60 |
patiEnt anaLysis
ovErviEw - CoMparE
In this overview, two training sessions
are compared.
The illustration shows measured values
for:
- HR
- BP
- SpO2
- METs
- W/kg
- Load
- RPM
- Spd.
- Slp.
- Energy
- Distance
- Weight
From the drop-down lists, select the pe-
riod of time of the training sessions and
the values you want to compare. The re-
sults will be displayed in the form of bar
charts. All parameter values (such as HR,
BP, or SpO2) from the two sessions can
be compared in this way.
Again, all information about the training
sessions are presented in tabular form
below the bar charts.
With
[ Print ] you obtain a printout of the
overview.
| 61
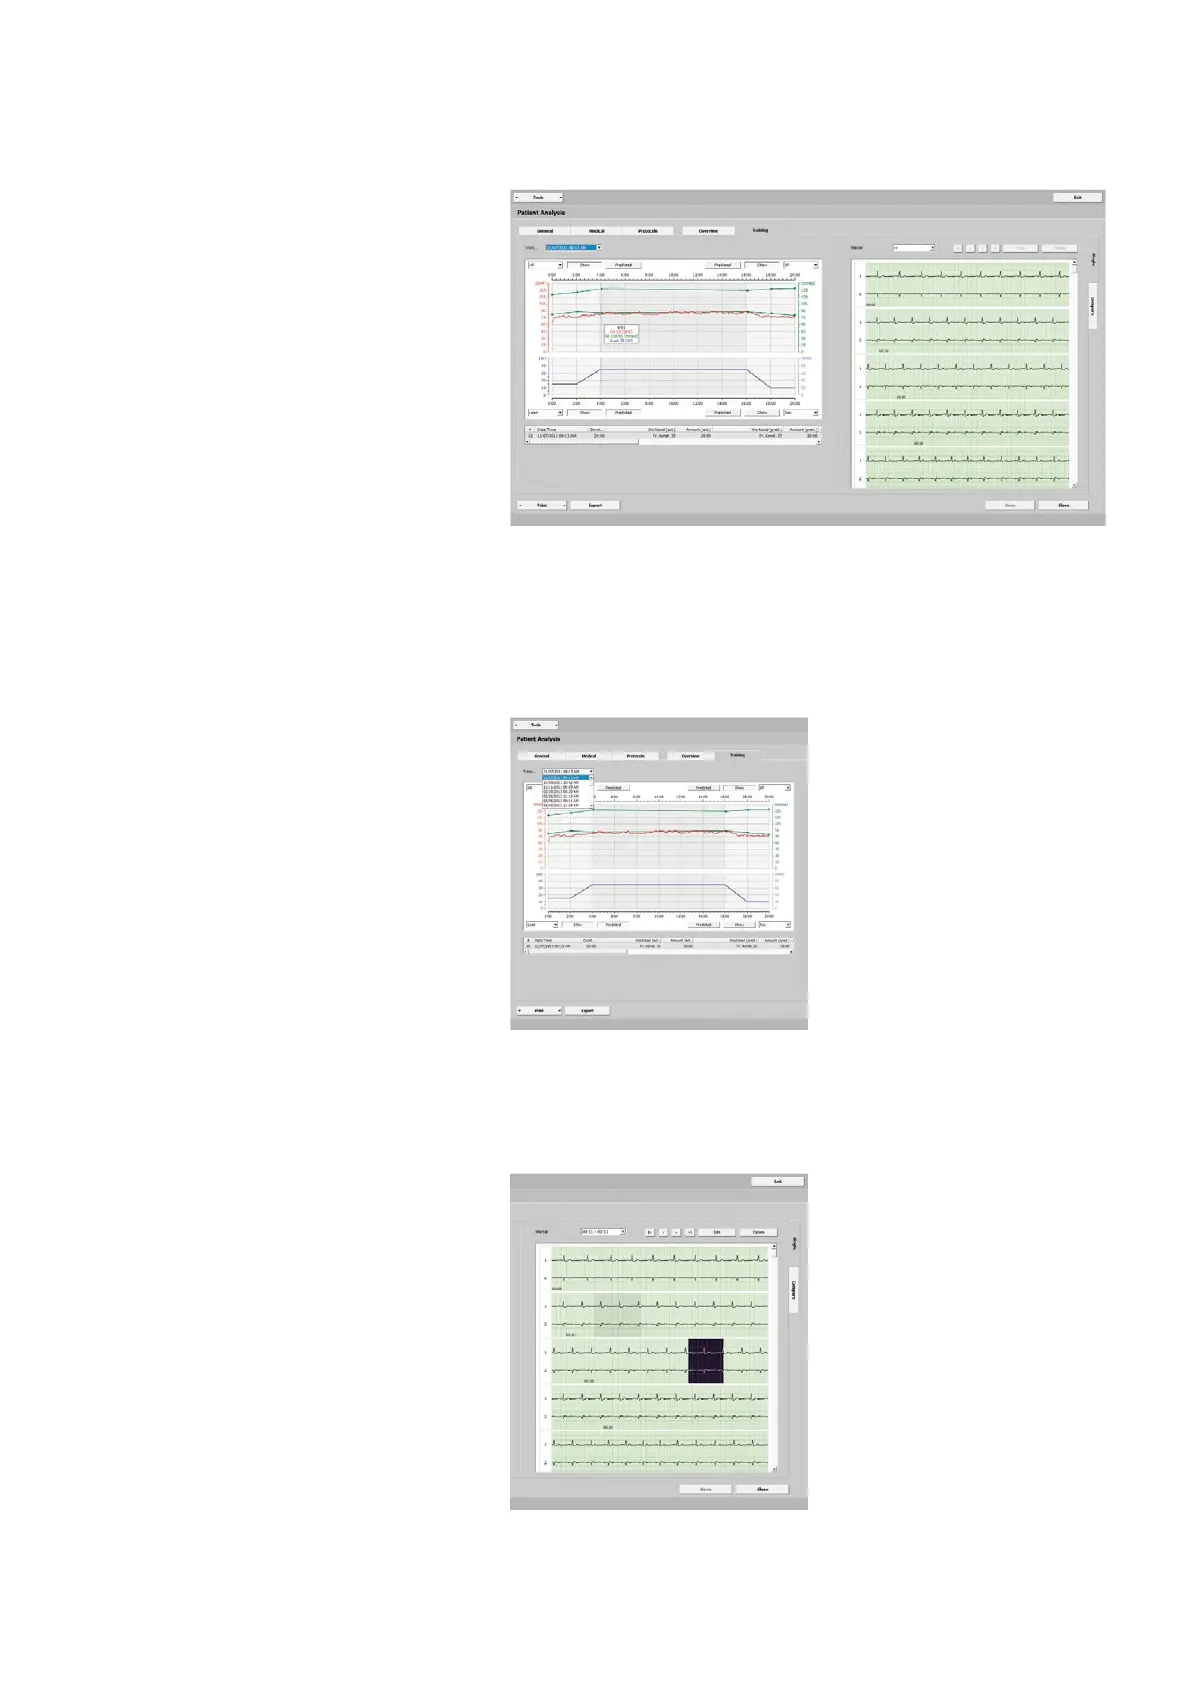
patiEnt anaLysis
training - singLE
The diagram presents the parameter val-
ues obtained during the training:
- HR
- BP
- SpO2
- METs
- W/kg
- Load
- RPM
- Spd.
- Slp.
Next to the diagram you see the full-dis-
closure ECG. As you move the mouse
cursor over the diagram, the correspond-
ing values will be displayed in a window.
The exercise phase is identified with a
dark background color.
Under Training you will find all training
sessions of this patient, sorted by date
and time.
Analyzing the Training Sessions
In the corners of the diagram, select the
events to be shown in the diagram (HR,
BP, SpO2, etc.).
Click [ Show ] to alternately show and hide
the line. Click the [ Predicted ] button to
show the predicted value.
If you click any point on the diagram, the
ECG display will be updated to show the
corresponding segment.
You can drag the scroll box over the
entire length of the scroll bar to get an
overview of the ECG.
If you detect signs of a dysrhythmia, for
example, highlight the corresponding
segment by clicking the mouse button
and dragging the mouse.