74
Display
(continued)
(12)
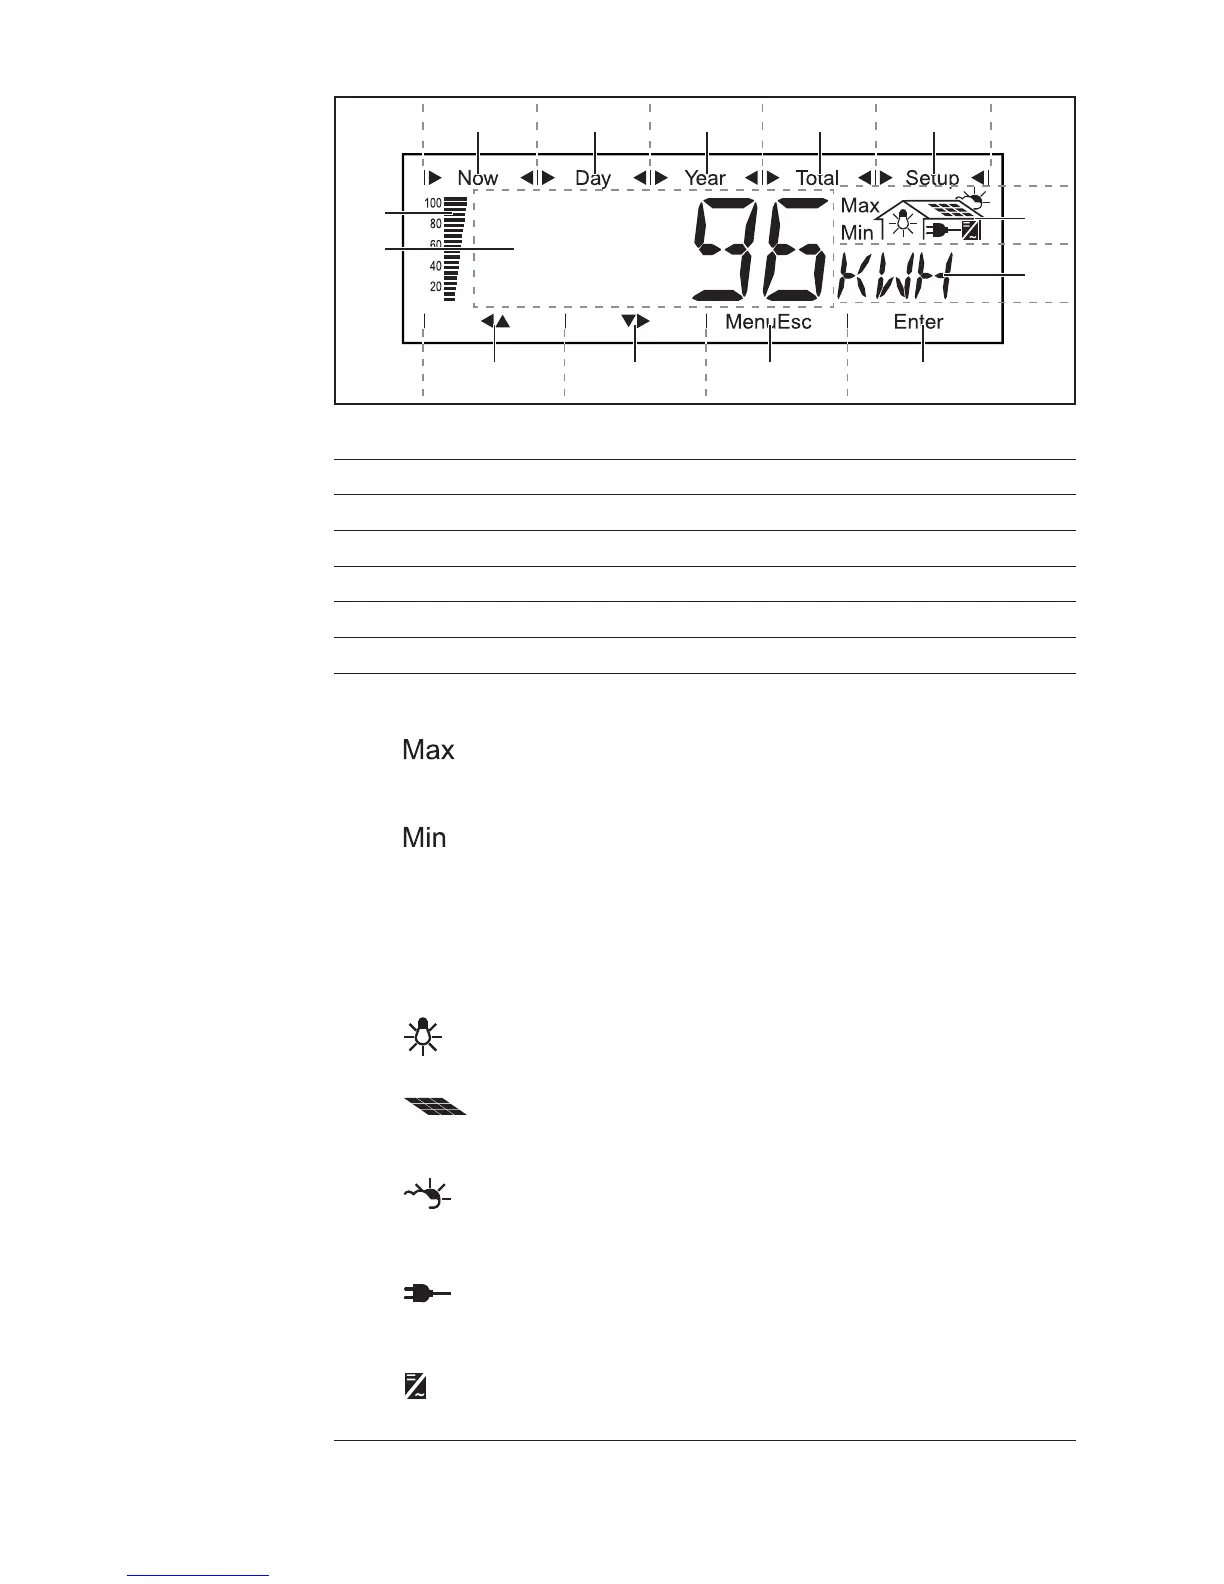
(1) (2) (3) (4) (5)
(6)
(7)
(8)(9)(10)(11)
(13)
Display
... indicates the maximum value within the period of obser-
vation (depending on the display mode chosen)
... indicates the minimum value within the period of obser-
vation (depending on the mode of display chosen)
Important The Min. and Max. values may not corres-
pond to the absolute extreme values, as the measured
data are recorded at two second intervals.
... appears with data readings that are transmitted by the
energy meter (optional)
... appears with data readings that are directly related to
the solar modules
... appears with data readings that are related to environ-
mental conditions, like solar irradiance and temperature
(optional)
... appears with AC data readings that are directly related
to the grid
... appears with data readings that are related directly to
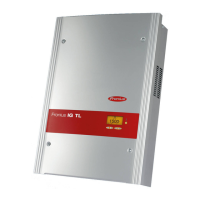
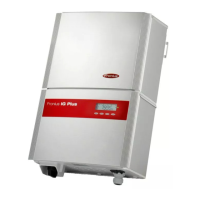
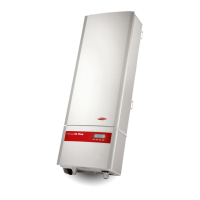
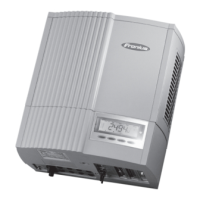
the Fronius IG Plus unit
Item Function
(1) Icons for the ‘Now’ display mode
(2) Icons for the ‘Day’ display mode
(3) Icons for the ‘Year’ display mode
(4) Icons for the ‘Total’ display mode
(5) Icons for the ‘Setup’ display mode
(6) Icons for operating conditions