138
IIDTool
GAP Diagnostic 2023-09-12 All Rights Reserved
User Manual G3 units: Version 37, Firmware V4.0
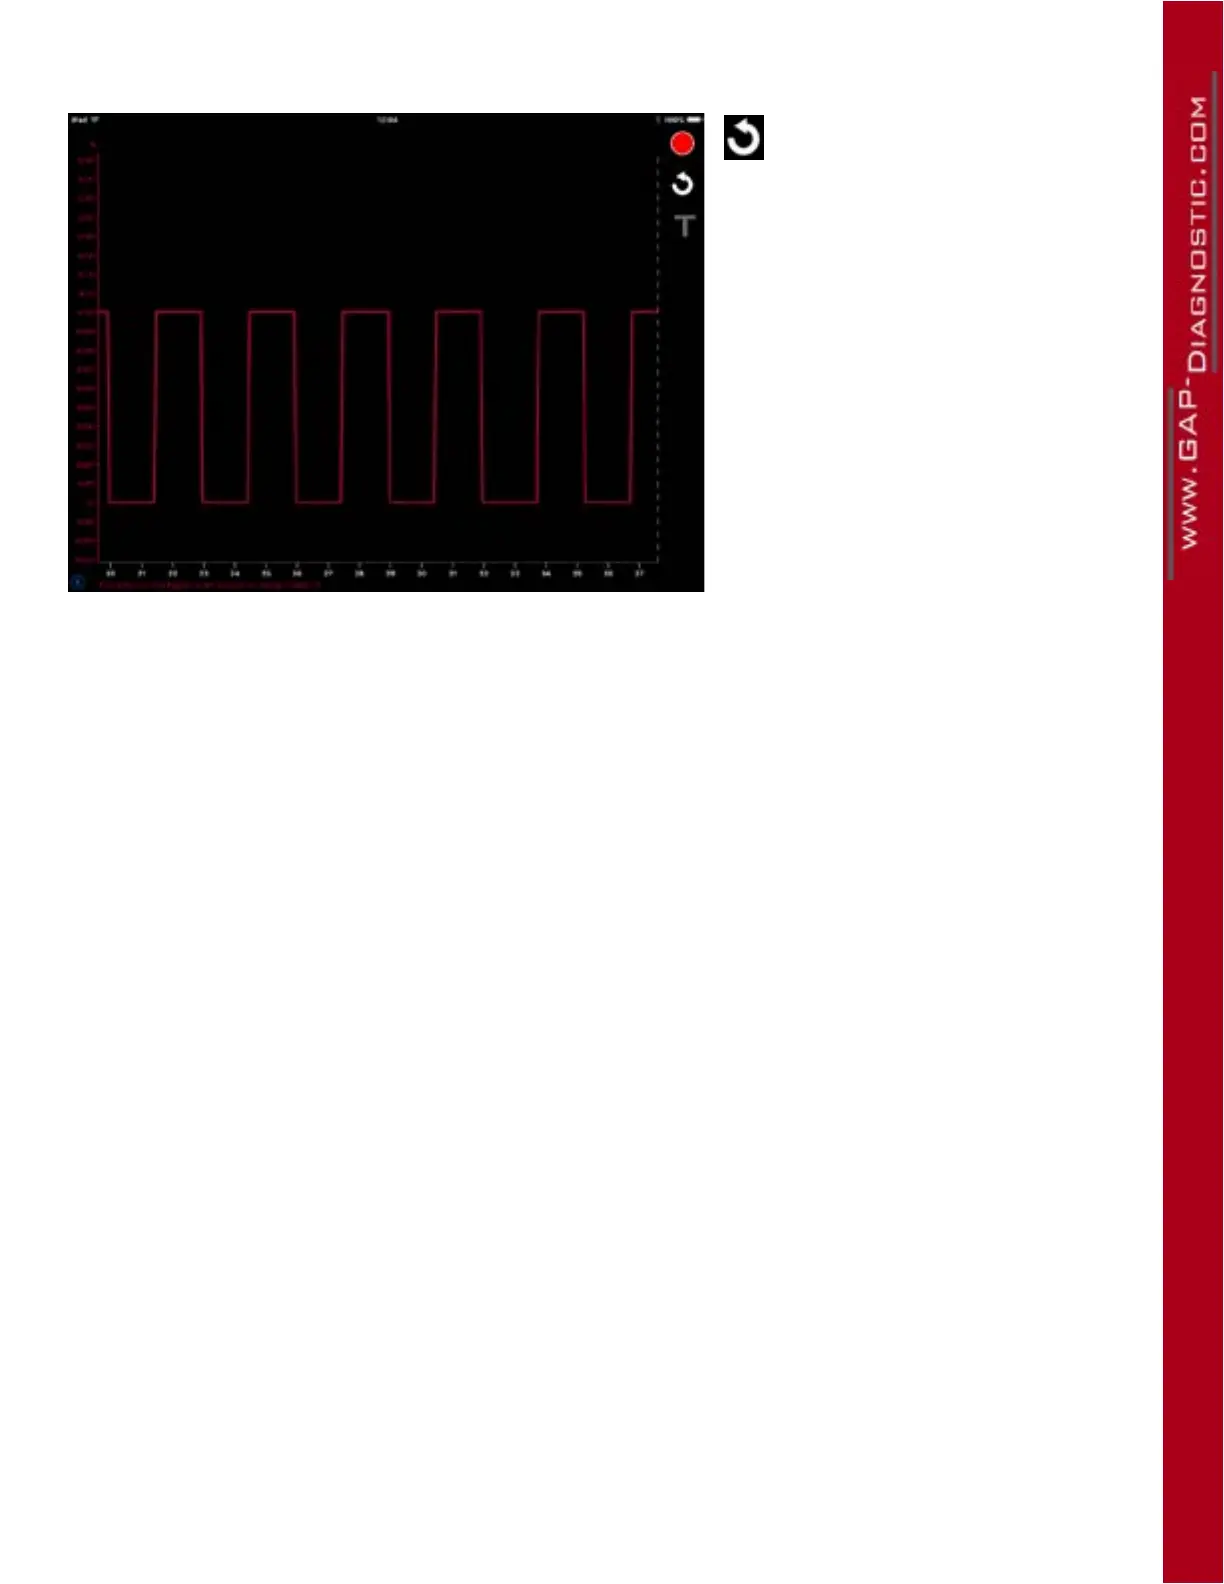
Figure 63. LV : Graph options
This button will reset the time (x)
axis back to 0 seconds.
The T symbol is used to enable or
disable the triggers. More details on
the triggers can be found here: Trig-
ger feature.
To highlight a curve, simply click on
the live value Y axis.
The cursor (far right dotted line) can
be moved by swiping a nger over it.
The live values data will be relative to
its X axis position.


 To Next Page