GE Analytical Instruments ©2009 11 of 236 DLM 90488-01 Rev. A
List of Figures
Figure 1 Analyzer Schematic . . . . . . . . . . . . . . . . . . . . . . . . . . . . . . . . . . . . . . . . . . . . . . . . . . . . . . . . . . . . .54
Figure 2 Clearances Required for Installation of the Analyzer . . . . . . . . . . . . . . . . . . . . . . . . . . . . . .63
Figure 3 Left Side Dimensions of the Analyzer . . . . . . . . . . . . . . . . . . . . . . . . . . . . . . . . . . . . . . . . . . . . .64
Figure 4 Right Side Dimensions of the Analyzer . . . . . . . . . . . . . . . . . . . . . . . . . . . . . . . . . . . . . . . . . . .65
Figure 5 Filling the DI Water Reservoir . . . . . . . . . . . . . . . . . . . . . . . . . . . . . . . . . . . . . . . . . . . . . . . . . . . .67
Figure 6 Wiring Diagram for the 4-20 mA Connection . . . . . . . . . . . . . . . . . . . . . . . . . . . . . . . . . . . . .71
Figure 7 Wiring Option for Binary Input Using Analyzer’s Internal Supply . . . . . . . . . . . . . . . . . . . .72
Figure 8 Wiring Option for Binary Input Using External Supply . . . . . . . . . . . . . . . . . . . . . . . . . . . . . .72
Figure 9 Input and Output Connectors . . . . . . . . . . . . . . . . . . . . . . . . . . . . . . . . . . . . . . . . . . . . . . . . . . . .74
Figure 10 Wiring AC Power Conduit (Arrows Indicate Connection Points) . . . . . . . . . . . . . . . . . . . . .76
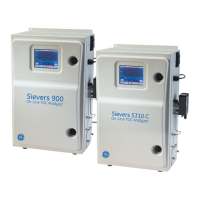
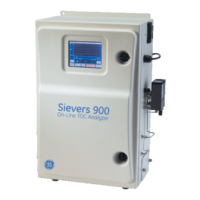
Figure 11 The Sievers 900 On-Line TOC Analyzer Main Screen . . . . . . . . . . . . . . . . . . . . . . . . . . . . . . .90
Figure 12 The Setup Tab . . . . . . . . . . . . . . . . . . . . . . . . . . . . . . . . . . . . . . . . . . . . . . . . . . . . . . . . . . . . . . . . . .92
Figure 13 Selecting the Reagent Flow Method . . . . . . . . . . . . . . . . . . . . . . . . . . . . . . . . . . . . . . . . . . . . . .97
Figure 14 The Data Tab . . . . . . . . . . . . . . . . . . . . . . . . . . . . . . . . . . . . . . . . . . . . . . . . . . . . . . . . . . . . . . . . . 100
Figure 15 Specifying a Start Date on the View Data Screen . . . . . . . . . . . . . . . . . . . . . . . . . . . . . . . . 102
Figure 16 Graphing the Data History . . . . . . . . . . . . . . . . . . . . . . . . . . . . . . . . . . . . . . . . . . . . . . . . . . . . . 103
Figure 17 The I/O Tab . . . . . . . . . . . . . . . . . . . . . . . . . . . . . . . . . . . . . . . . . . . . . . . . . . . . . . . . . . . . . . . . . . . 105
Figure 18 The Maintenance Tab . . . . . . . . . . . . . . . . . . . . . . . . . . . . . . . . . . . . . . . . . . . . . . . . . . . . . . . . . 112
Figure 19 The Advanced Menu with One Program Language Loaded . . . . . . . . . . . . . . . . . . . . . . 115
Figure 20 The IOS System. . . . . . . . . . . . . . . . . . . . . . . . . . . . . . . . . . . . . . . . . . . . . . . . . . . . . . . . . . . . . . . . 120
Figure 21 Menu Map with Minimum User Level . . . . . . . . . . . . . . . . . . . . . . . . . . . . . . . . . . . . . . . . . . . 124
Figure 22 The Sample Flow Rate Calibration Summary Screen . . . . . . . . . . . . . . . . . . . . . . . . . . . . 143
Figure 23 Selecting the Concentration for a Single-Point Calibration . . . . . . . . . . . . . . . . . . . . . . . 144
Figure 24 Reviewing TC and IC Values from a Single-Point Calibration . . . . . . . . . . . . . . . . . . . . . 146
Figure 25 TC Values Summary Screen in a Multi-Point Calibration. . . . . . . . . . . . . . . . . . . . . . . . . . 149
Figure 26 IC Values Summary Screen in a Multi-Point Calibration . . . . . . . . . . . . . . . . . . . . . . . . . . 149
Figure 27 System Suitability Summary Screen . . . . . . . . . . . . . . . . . . . . . . . . . . . . . . . . . . . . . . . . . . . . 153
Figure 28 The Autoreagent Calibration Summary Screen . . . . . . . . . . . . . . . . . . . . . . . . . . . . . . . . . 155
Figure 29 The Autoreagent Verification Summary Screen . . . . . . . . . . . . . . . . . . . . . . . . . . . . . . . . . 157
 Loading...