6.4 Displaying Harmonics
104
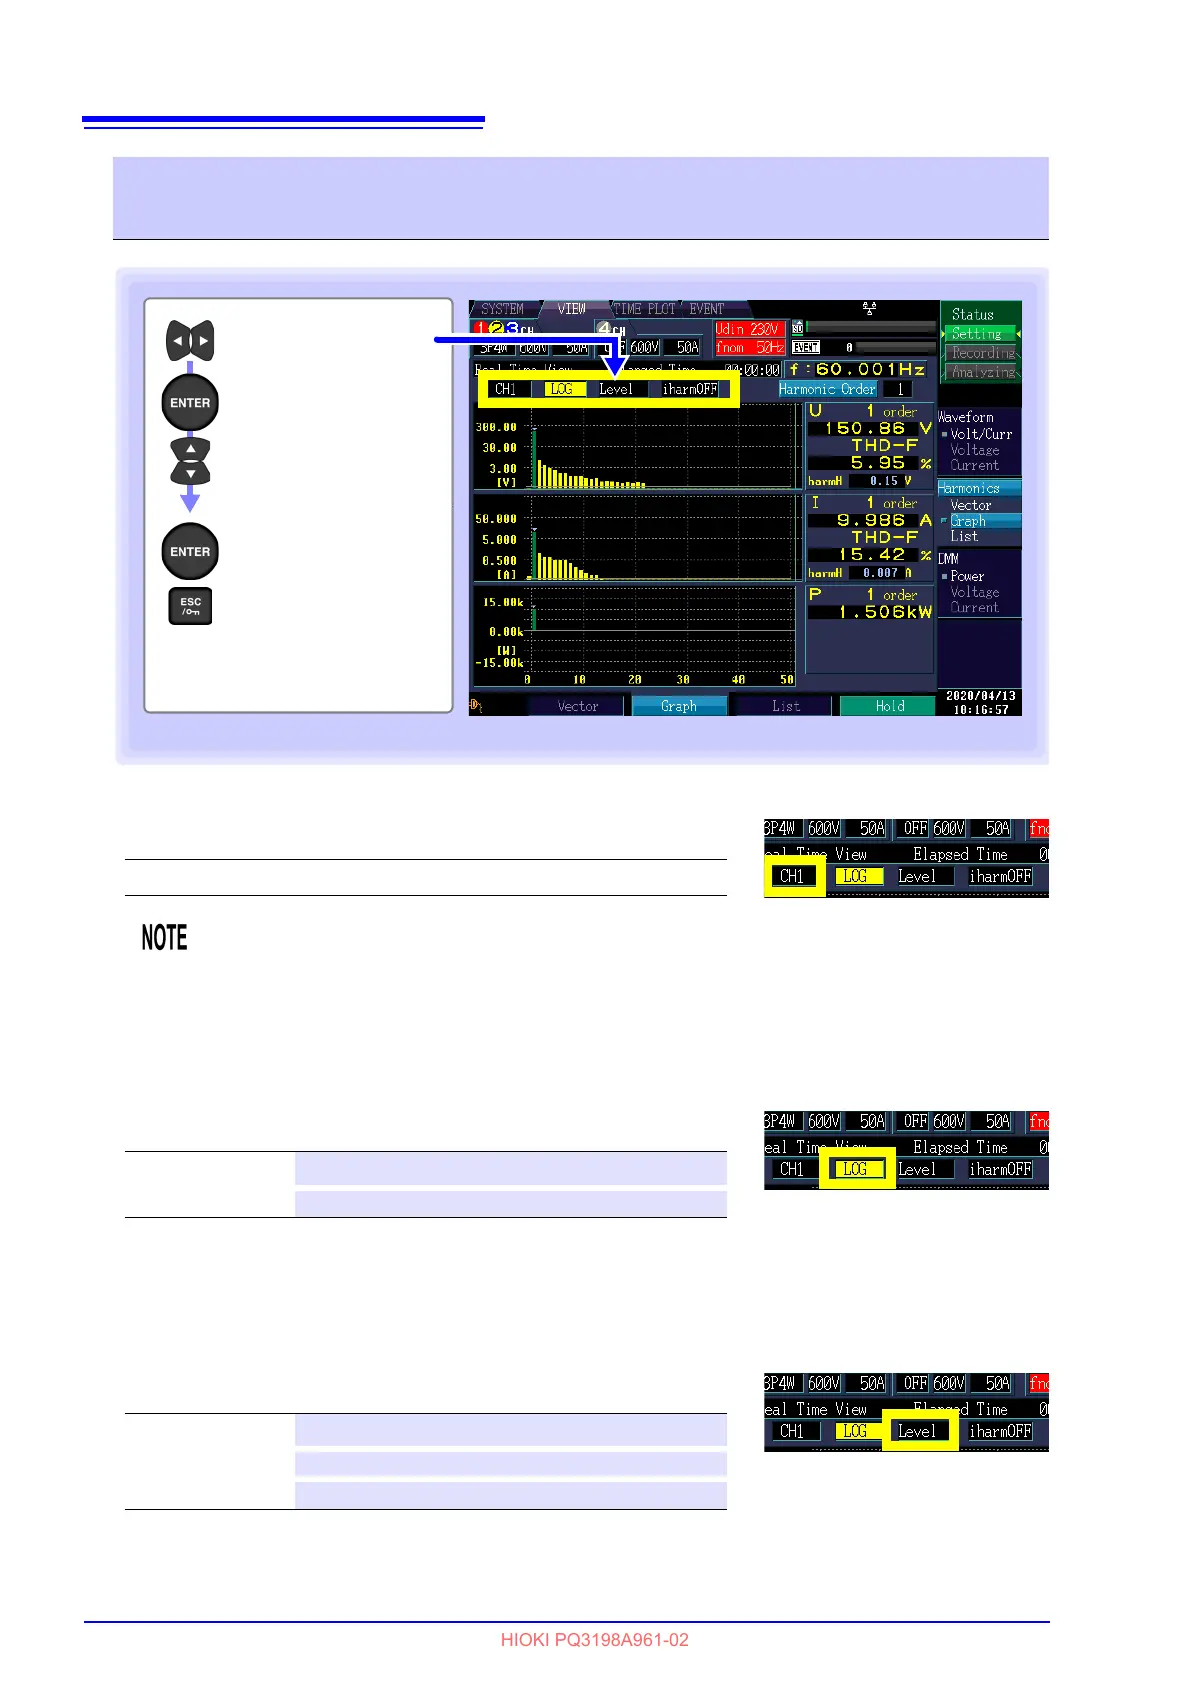
Displayed channel
Axis display
If you select the logarithmic display method, the vector is
easy to see even at low levels.
RMS/phase angle/content percentage display
Select the harmonic bar graph display (RMS value display, phase angle display, or content percentage).
The harmonic power phase angle indicates the harmonic voltage-
current phase difference.
In the level display, the high-order harmonic component bar graph and measured value (harmH) are dis-
played next to the U and I bar graphs.
Changing the display channel, axis display, RMS/phase angle dis-
play, and inter-harmonics
Setting Contents:( ∗ : Default setting)
CH1∗/ CH2/ CH3/ CH4/ sum
Display the
pull-down menu
Select a setting
Accept setting
Cancel
Select a setting
When the 400 Hz measurement frequency is selected, harmonic
analysis is performed up to the 10th order, and inter-harmonic analysis
is not available.
Setting Contents:( ∗ : Default setting)
LINEAR∗
Linear display
LOG Log Logarithmic display
Setting Contents:( ∗ : Default setting)
Level∗
RMS
Phase Phase angle
Content Content percentage
 Loading...


