7.5 Displaying Flicker Values in Graph and List Form
134
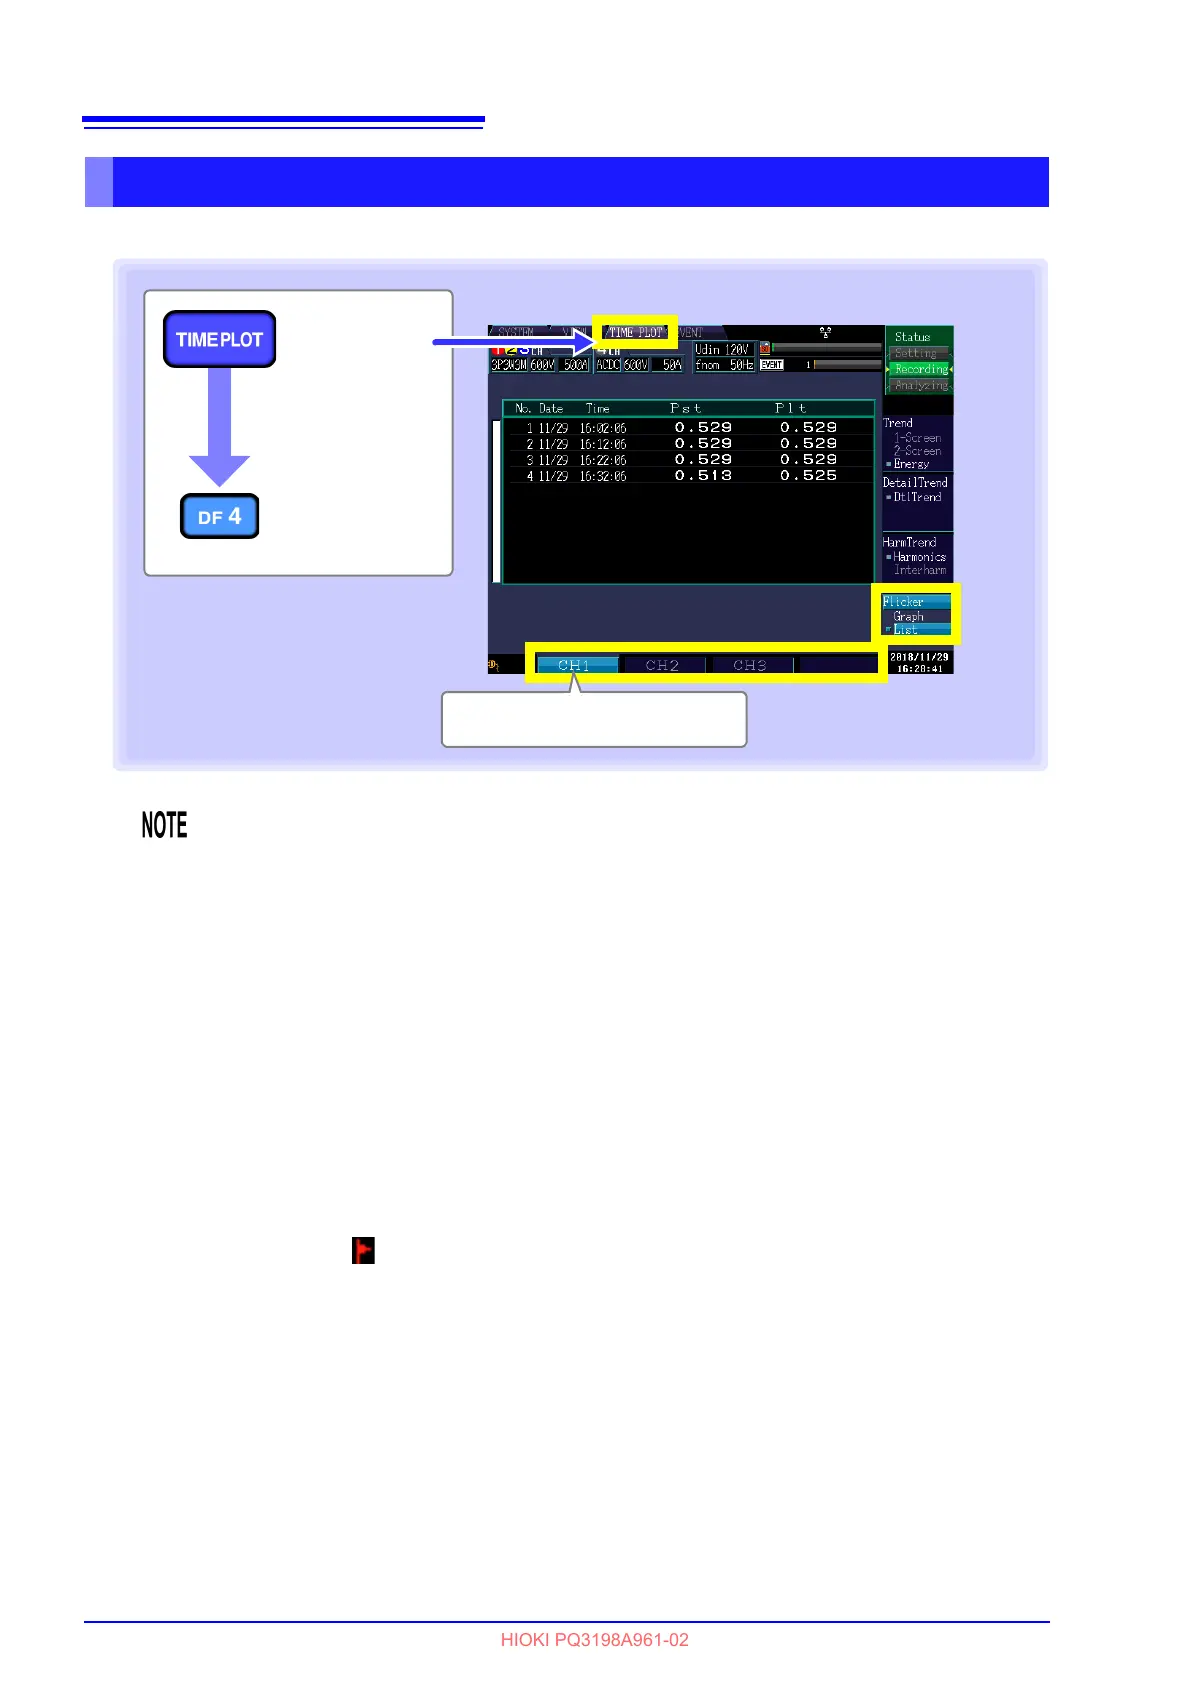
This section describes how to display Pst and Plt statistics along with the time and date every 10 minutes.
Displaying an IEC flicker list
[TIME PLOT]
screen
[Flicker]
[List]
Press the F key to select a channel.
•Pst:
Short interval flicker value
•Plt:
Long interval flicker value
• Statistics consist of a list of the following IEC flicker statistics (Pst and Plt) along with the
time and date, which is updated every 10 minutes.
• This information will not be displayed unless [Flicker] has been set to [Pst, Plt] in
[SYSTEM]-DF1 [Main]-F2 [Measure2].
• EN50160,”Voltage Characteristics in Public D
istribution Systems,” gives “Plt ≤ 1 for 95%
of a week” as a limit value.
• For IEC 61000 Plt values, use only the values shown with even n
umbered 2-hour inter-
vals, and discard the other Plt values. The oth
er Plt values are provided for information
only, and are not IEC 61000 Plt values.
Flags
The measurement algorithm may generate unreliab
le values during dips, swells, and inter-
ruptions. The possible
unreliability of these measured values (set-values) is indicated by
flags that are displayed with TIME PLOT data when dips, swells, or interruptions occur.
Even when dip, swell, and interruption events have been turned off, flags are shown with
measurement data when a dip or interruption (when the voltage falls 10% relative to the
nominal voltage) or swell (when the voltage rises 200%) is judged to have occurred.
Flag icon: