A12
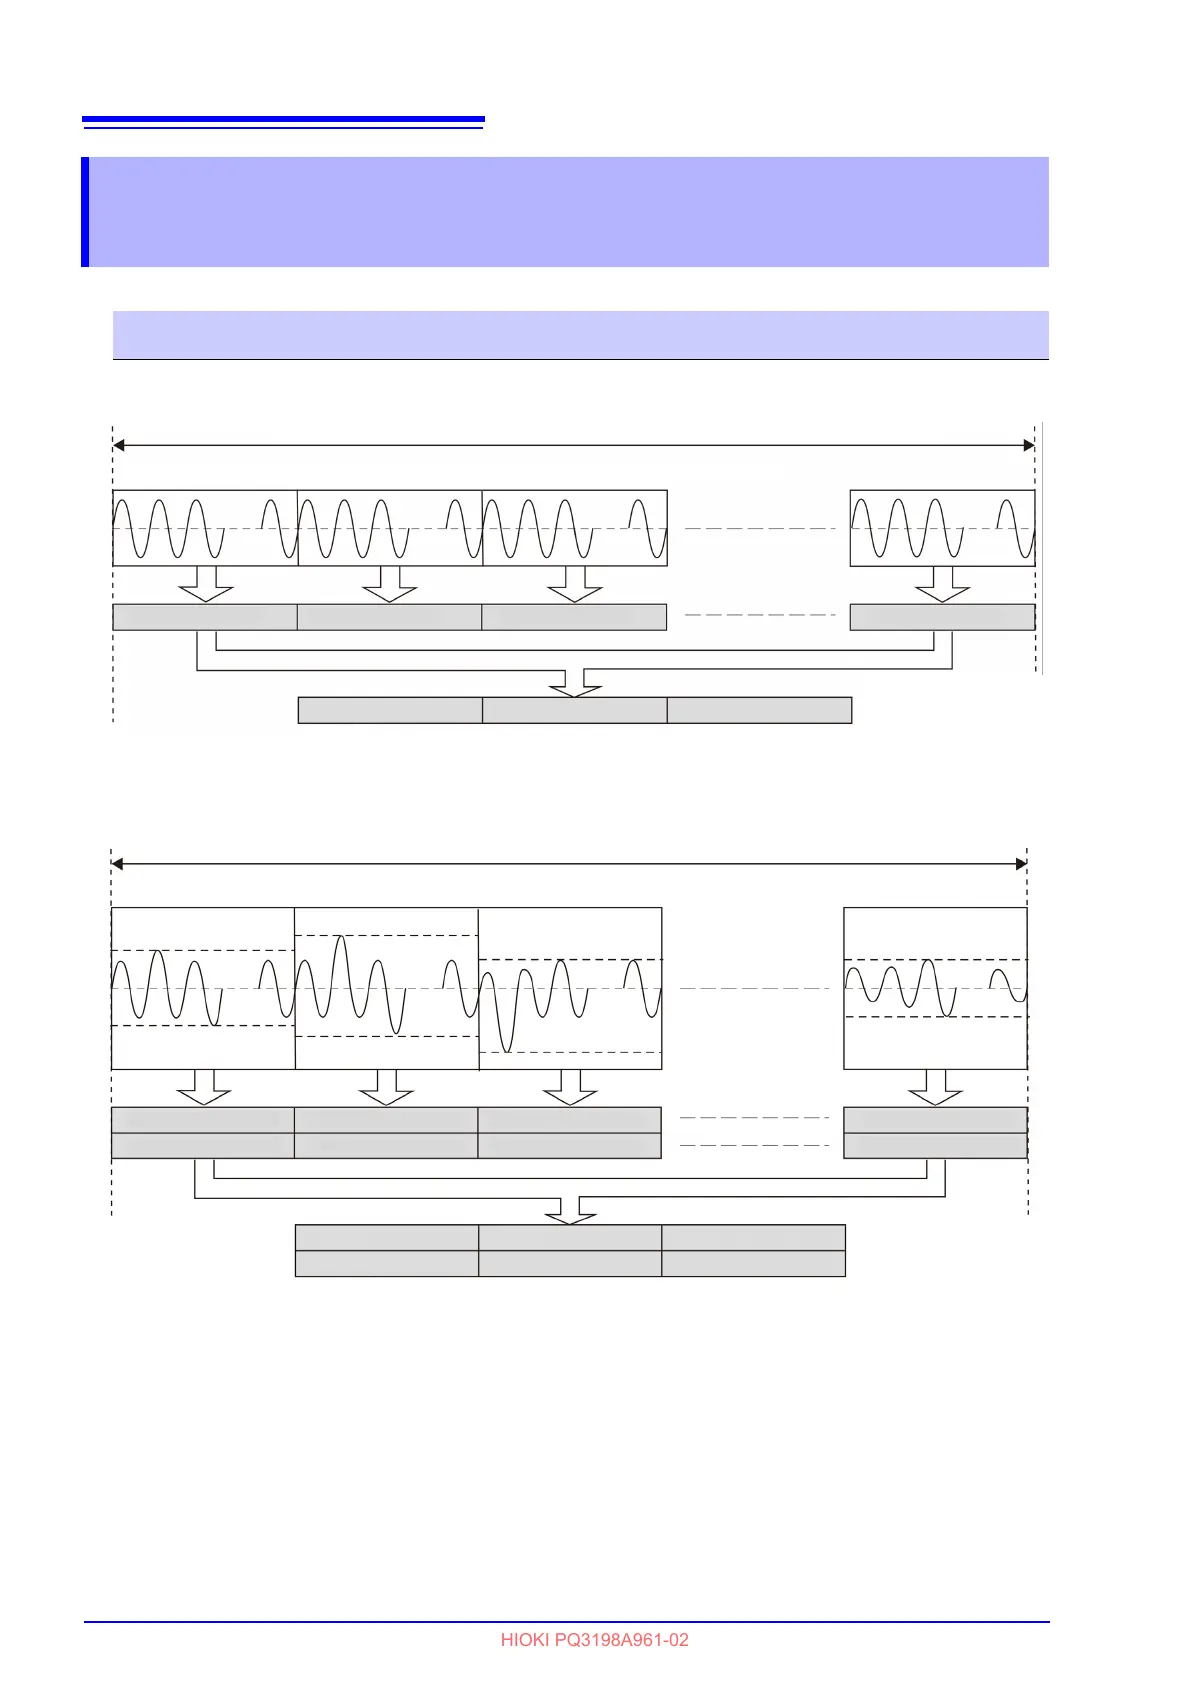
When recording RMS values:
When recording peak values:
Appendix 4 Recording TIME PLOT Data and
Event Waveforms
TIME PLOT screen (trends and harmonic trends)
SYSTEM_DF1 [Record] TIME PLOT Interval (setting period)
Approx. 200 ms aggregation (50 Hz: 10 cycles, 60 Hz: 12 cycles)
RMS value 1 RMS value 2 RMS value 3 RMS value N
Example:
when interval:1 min,
N=300
MAX RMS value AVG RMS value MIN RMS value
Recording Recording Recording
SYSTEM_DF1 [Record] TIME PLOT Interval (setting period)
Approx. 200 ms aggregation (50 Hz: 10 cycles, 60 Hz: 12 cycles)
Positive peak value 1
Example:
when interval:1 min,
N=300
MAX positive peak value
Recording Recording Recording
Positive peak value 2 Positive peak value 3 Positive peak value N
Negative peak value 1 Negative peak value 2 Negative peak value 3 Negative peak value N
MAX negative peak value
AVG positive peak value MIN positive peak value
AVG negative peak value MIN negative peak value


 To Next Page