[Analyzing]
mode
Screen display switching with DF
keys
Displays the instant the event occurred.
Transient
Harmonics
DMM
Event
TrendData
HHarmonic
Current
Voltage
Power
List
Graph
Vector
Waveform
Voltage
Current
Volt/Curr
Event List
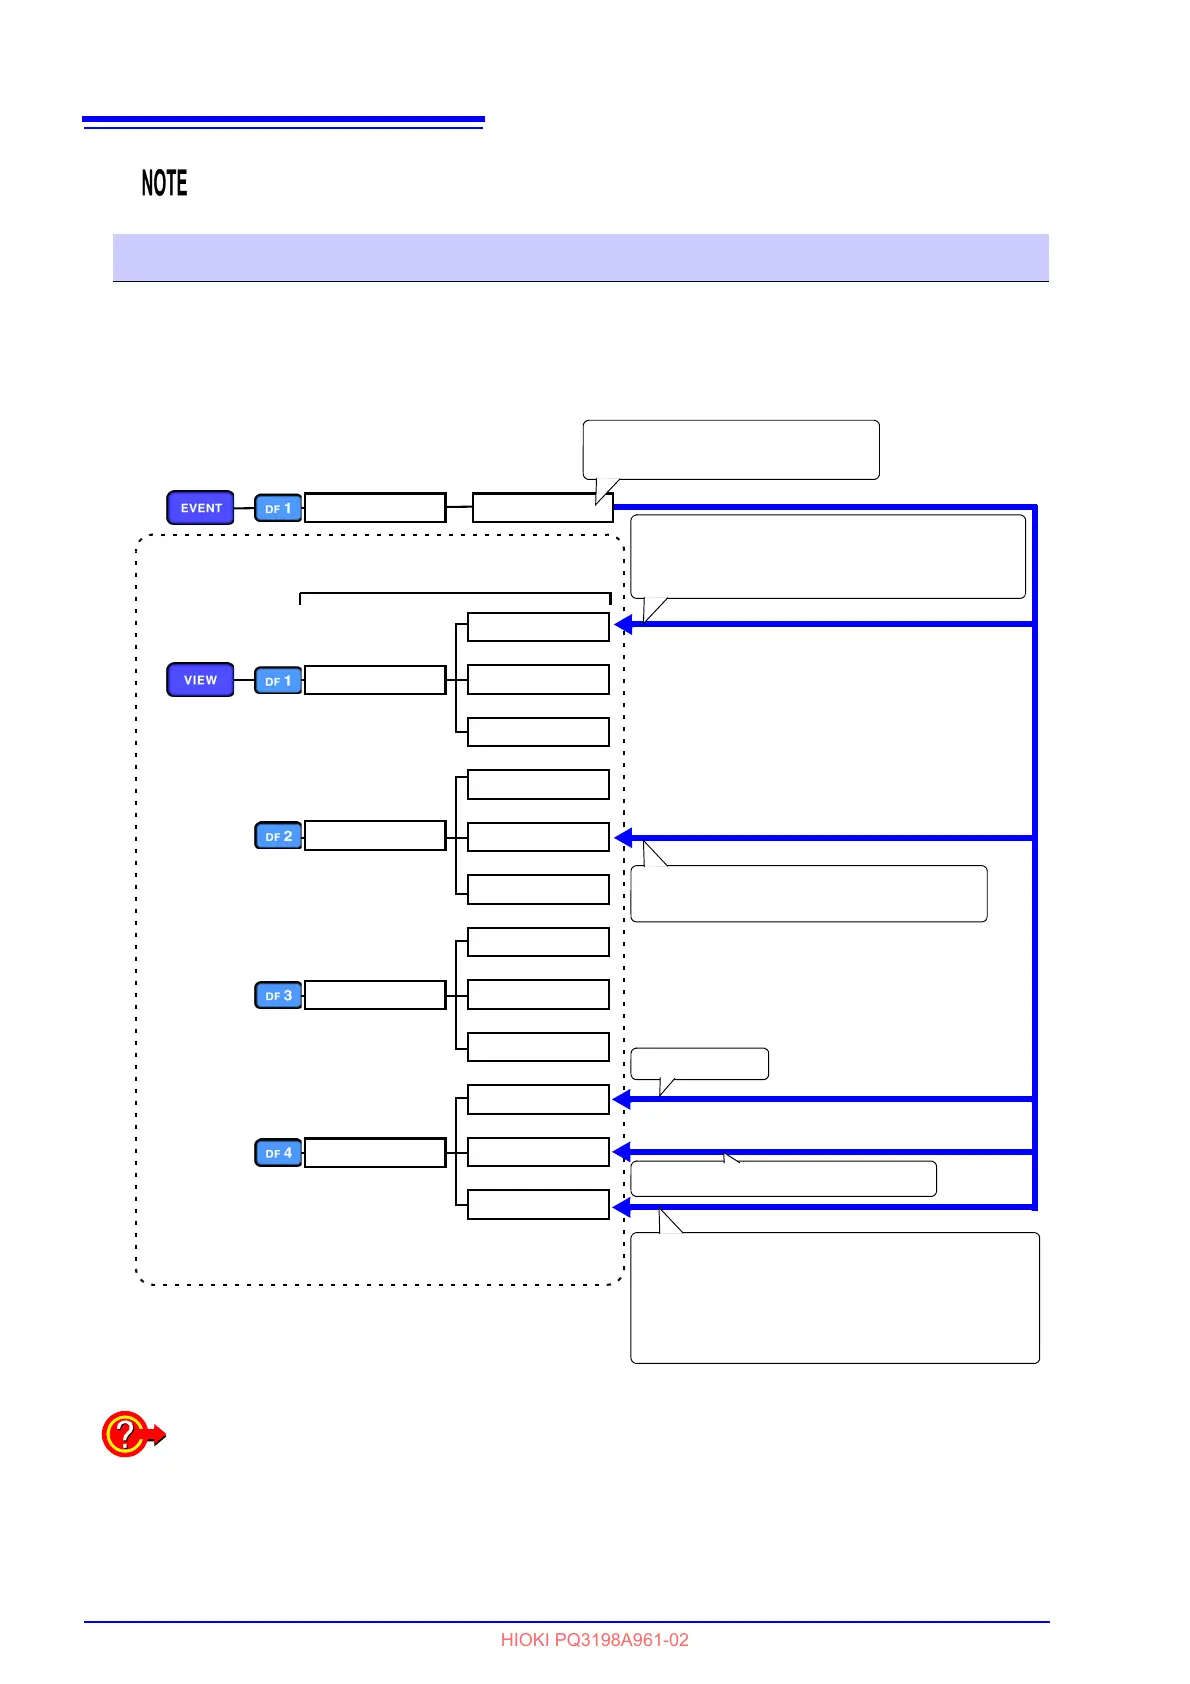
Event jump function
Moving the cursor to the event you wish to view on the event list and pressing the ENTER key displays the measurement data
for that time. The screen displayed initially varies with the event that occurred. Subsequently, you can press a DF key to display
the desired screen and check measurement data.
Frequency 200ms, one frequency cycle, voltage, cur-
rent, power, power factor, unbalance factor, distortion
factor, waveform comparison, timer, continuous, and
external events
Harmonic voltage, harmonic current, harmonic
power, and K factor events
Transient events
Swell, dip, interruption, and inrush current IN events
Note1: For OUT events, the display jumps to the [Volt/
Curr] screen.
Note2: When a series of swell, dip, interruption, or inrush
current IN events occur, there may be no fluctua-
tion data.
High-order harmonic component events
Move the cursor to the event you wish to
view and press the ENTER key.
 Loading...


