ENGINEERING MANUAL OF AUTOMATIC CONTROL
CHILLER, BOILER, AND DISTRIBUTION SYSTEM CONTROL APPLICATIONS
338
Pump Power Requirements
The pump curve in Figure 53 is part of a family of curves for a
pump. Each curve of the family represents a different size impeller
used with the pump at a specified rpm. It relates to the power
input required just to move the water (water power) as follows:
Water power, W = flow x pressure
Where:
flow = L/s
pressure = kPa
The motor driving the pump must have a power rating in excess
of water power to take care of bearing and seal friction,
recirculation within the housing, and impeller efficiency.
NOTE: Water power increases with pressure and flow. If flow
is allowed to increase, the motor may overload.
Courtesy of Aurora Pump
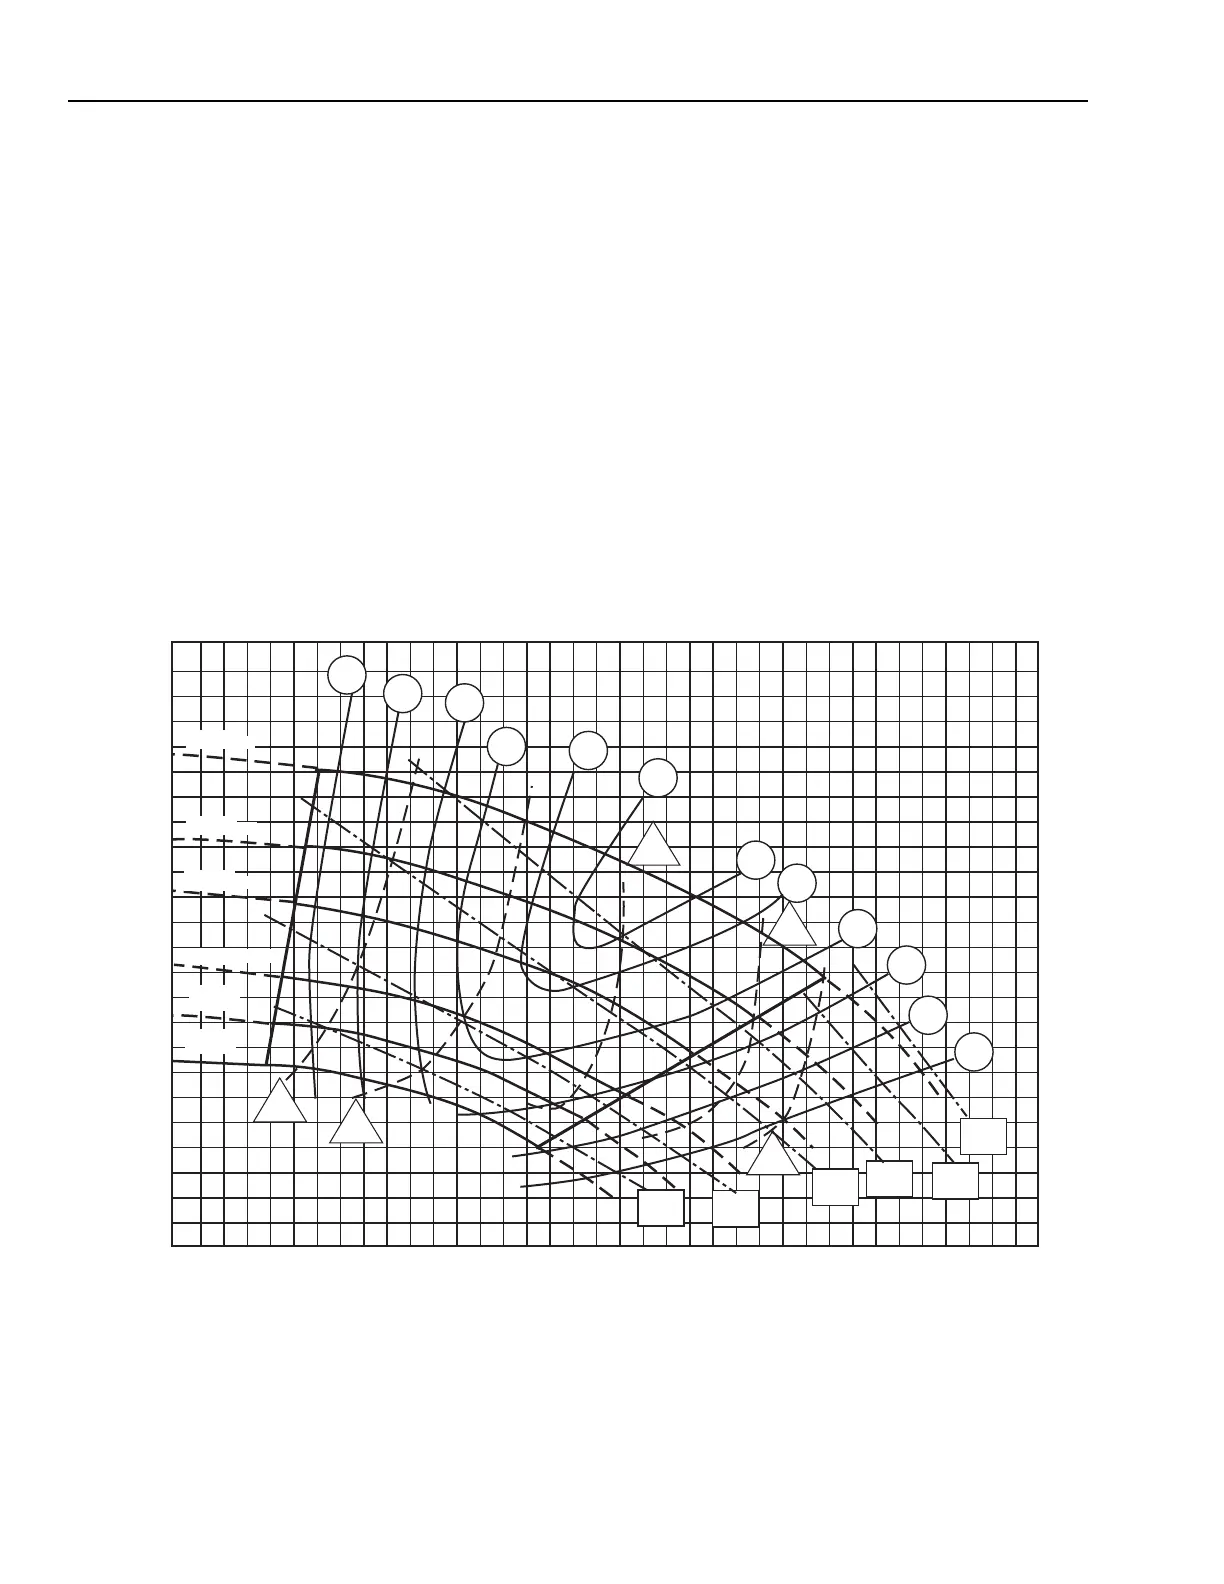
Fig. 54. 1150 RPM Typical Pump Curve.
Pump Performance Curves
Commercial pumps have performance curves showing the
following data for a given pump speed:
— Total pressure in kPa versus flow in L/s
— Total pressure versus flow for various impeller diameters
— Pump efficiency at various operating points
— Net positive suction pressure. Net positive suction
pressure is the absolute pressure in kPa required at the
suction inlet to prevent cavitation due to “boiling” and
formation of bubbles in the water.
Figure 54 is a typical performance curve showing some of
the preceding data. Impeller diameters are shown on the left.
Pump Efficiency
Pump efficiency is a comparison of water power developed
in the pump and motor power applied by the motor to the shaft
and impeller.
5.5
KW
7.5
KW
11
KW
15
KW
18.5
KW
22
KW
48
NPSH
55
NPSH
69
NPSH
103
NPSH
138
NPSH
50%
60%
70%
75%
80%
81%
81%
80%
75%
70%
60%
50%
0 12.5 25 37.5 50 62.5 75 87.5 100 112.5
0
60
120
180
240
300
380mm DIA
355mm DIA
330mm DIA
300mm DIA
280mm
DIA
250mm
DIA
CAPACITY (L/s)
TOTAL PRESSURE (kPa)
C4090