ENGINEERING MANUAL OF AUTOMATIC CONTROL
PSYCHROMETRIC CHART FUNDAMENTALS
42
EXAMPLES OF AIR MIXING PROCESS
The following examples illustrate use of the psychrometric chart
to plot values and determine conditions in a ventilating system.
The examples also show how to obtain the same results by
calculation. Example A requires only Chart No. 1. Example B
requires both Charts No. 1 and 2 since the outdoor air temperature
is in the range of Chart No. 2.
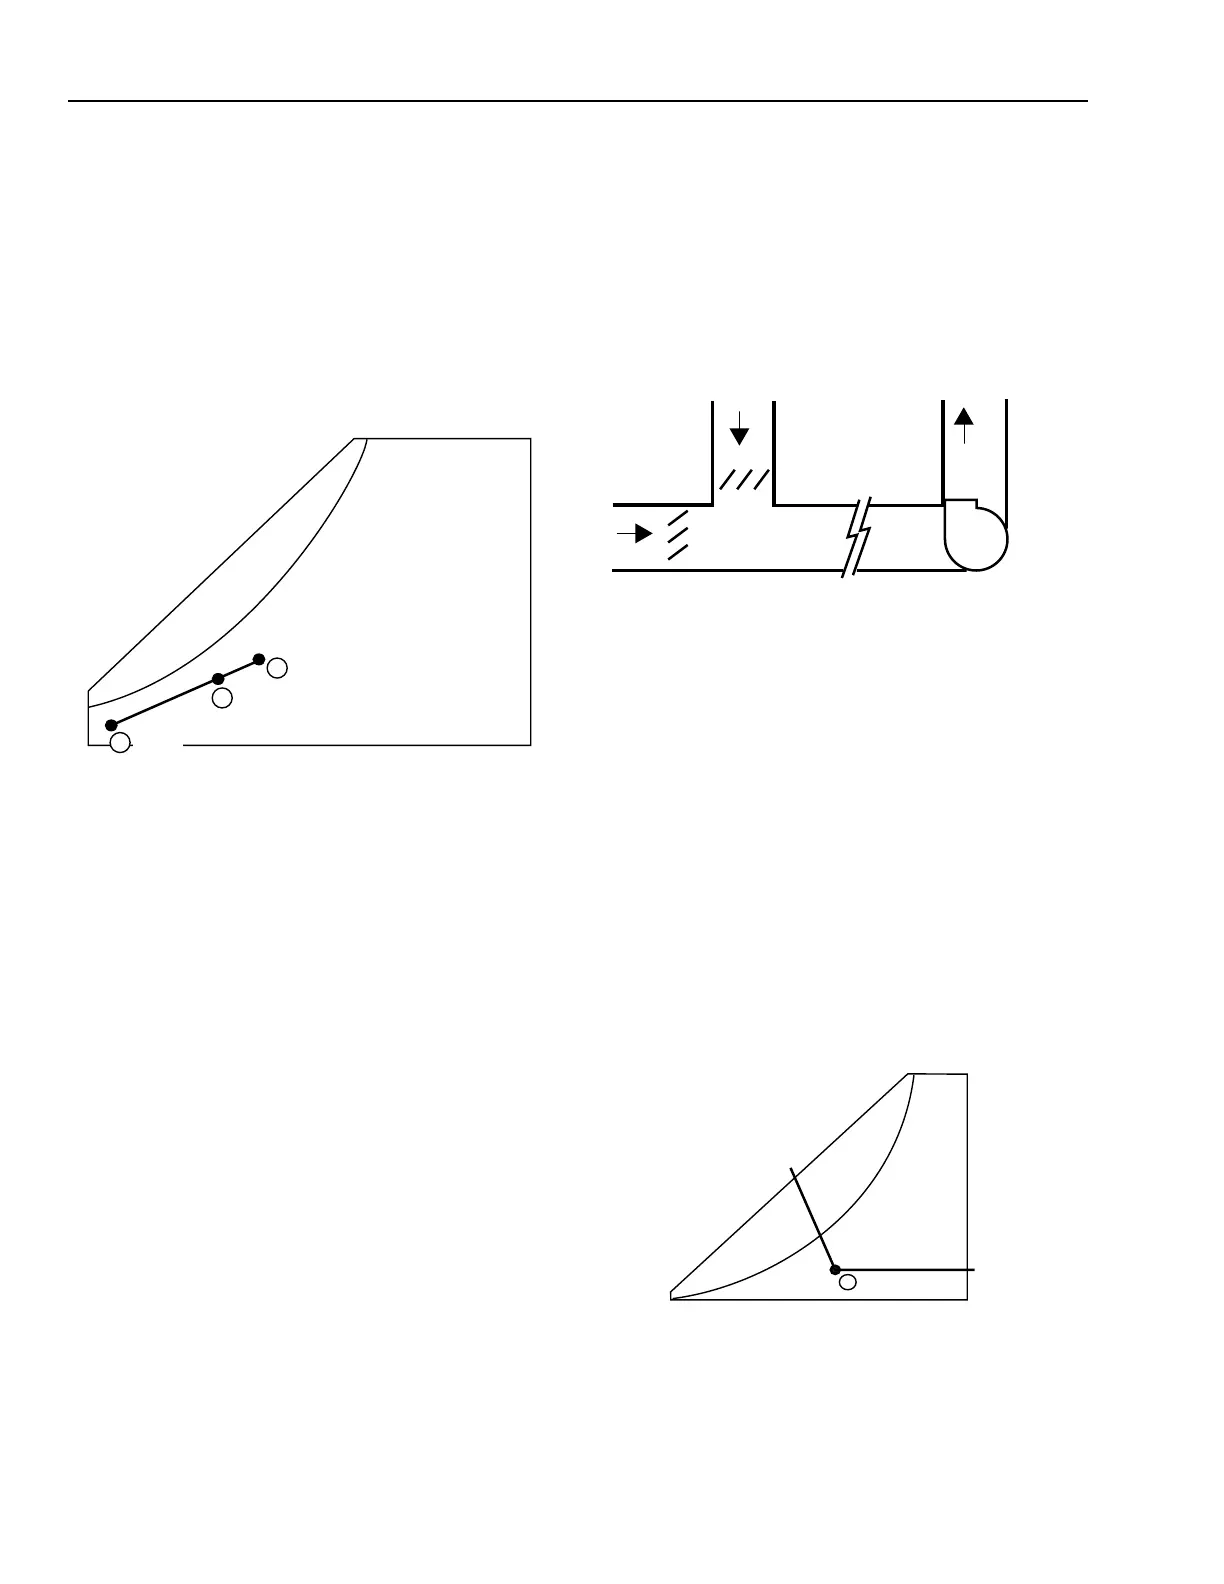
EXAMPLE A:
Plotting values where only Chart No. 1 (Fig. 6) is required.
Fig. 6. Example A, Chart No. 1.
In this example:
1. A fixed quantity of two-thirds return air and one-third
outdoor air is used.
2. The return air condition is 24°C dry bulb and 17°C
wet bulb.
3. Outdoor air condition is 2°C dry bulb and 40 percent rh.
To find the mixed air conditions at design:
1. Plot the return air (RA) condition (Point A) and outdoor
air (OA) condition (Point B).
2. Connect the two points with a straight line.
3. Calculate the mixed air dry-bulb temperature:
(2/3 x 75) + (1/3 x 36) = 16.5°C dry bulb
4. The mixed air conditions are read from the point at which
the line, drawn in Step 2, intersects the 16.5°C dry-bulb
line (Point C).
EXAMPLE B:
Plotting values when both Chart No. 1 and Chart No. 2 are
required.
In this example, a ventilating system (Fig. 7) is used to
illustrate how to plot data on Chart No. 2 and transfer values to
Chart No. 1. Chart No. 2 is similar to Chart No. 1 except that it
covers the –40°C to 10°C temperature range. This is the
temperature range immediately below that of Chart No. 1. Note
that there is an overlap of temperatures between 0°C and 10°C.
The overlap is important when transferring values from one
chart to another.
RA
DA
OA
N.C.
SUPPLY
FAN
C2055
Fig. 7. Example B, Ventilating System.
This example illustrates mixing two different air conditions
with no change in total heat (enthalpy). Any changes in the
total heat required to satisfy space conditions are made by
heating, cooling, humidification, or dehumidification after the
air is mixed.
In this example:
1. A fixed quantity of two-thirds return air and one-third
outdoor air is used.
2. The return air condition is 24°C dry bulb and 17°C
wet bulb.
3. Outdoor air condition is –12°C dry bulb and 50 percent rh.
To find the mixed air condition:
1. Plot the outdoor air (OA) condition on Chart No. 2,
Fig. 8
. 2. Plot the return air (RA) condition on Chart No. 1, Fig. 9.
Fig. 8. Example B, Chart No. 2.
C4323
C
A
RA
24°C DB
17°C WB
MA
16.5°C DB
B
OA
2°C DB
40% RH
B
C4325
–10.5 kJ/kg
0.7 g/kg
OA
–12°C DB
50% RH