ENGINEERING MANUAL OF AUTOMATIC CONTROL
CHILLER, BOILER, AND DISTRIBUTION SYSTEM CONTROL APPLICATIONS
341
Fig. 57. Matching Pump to System.
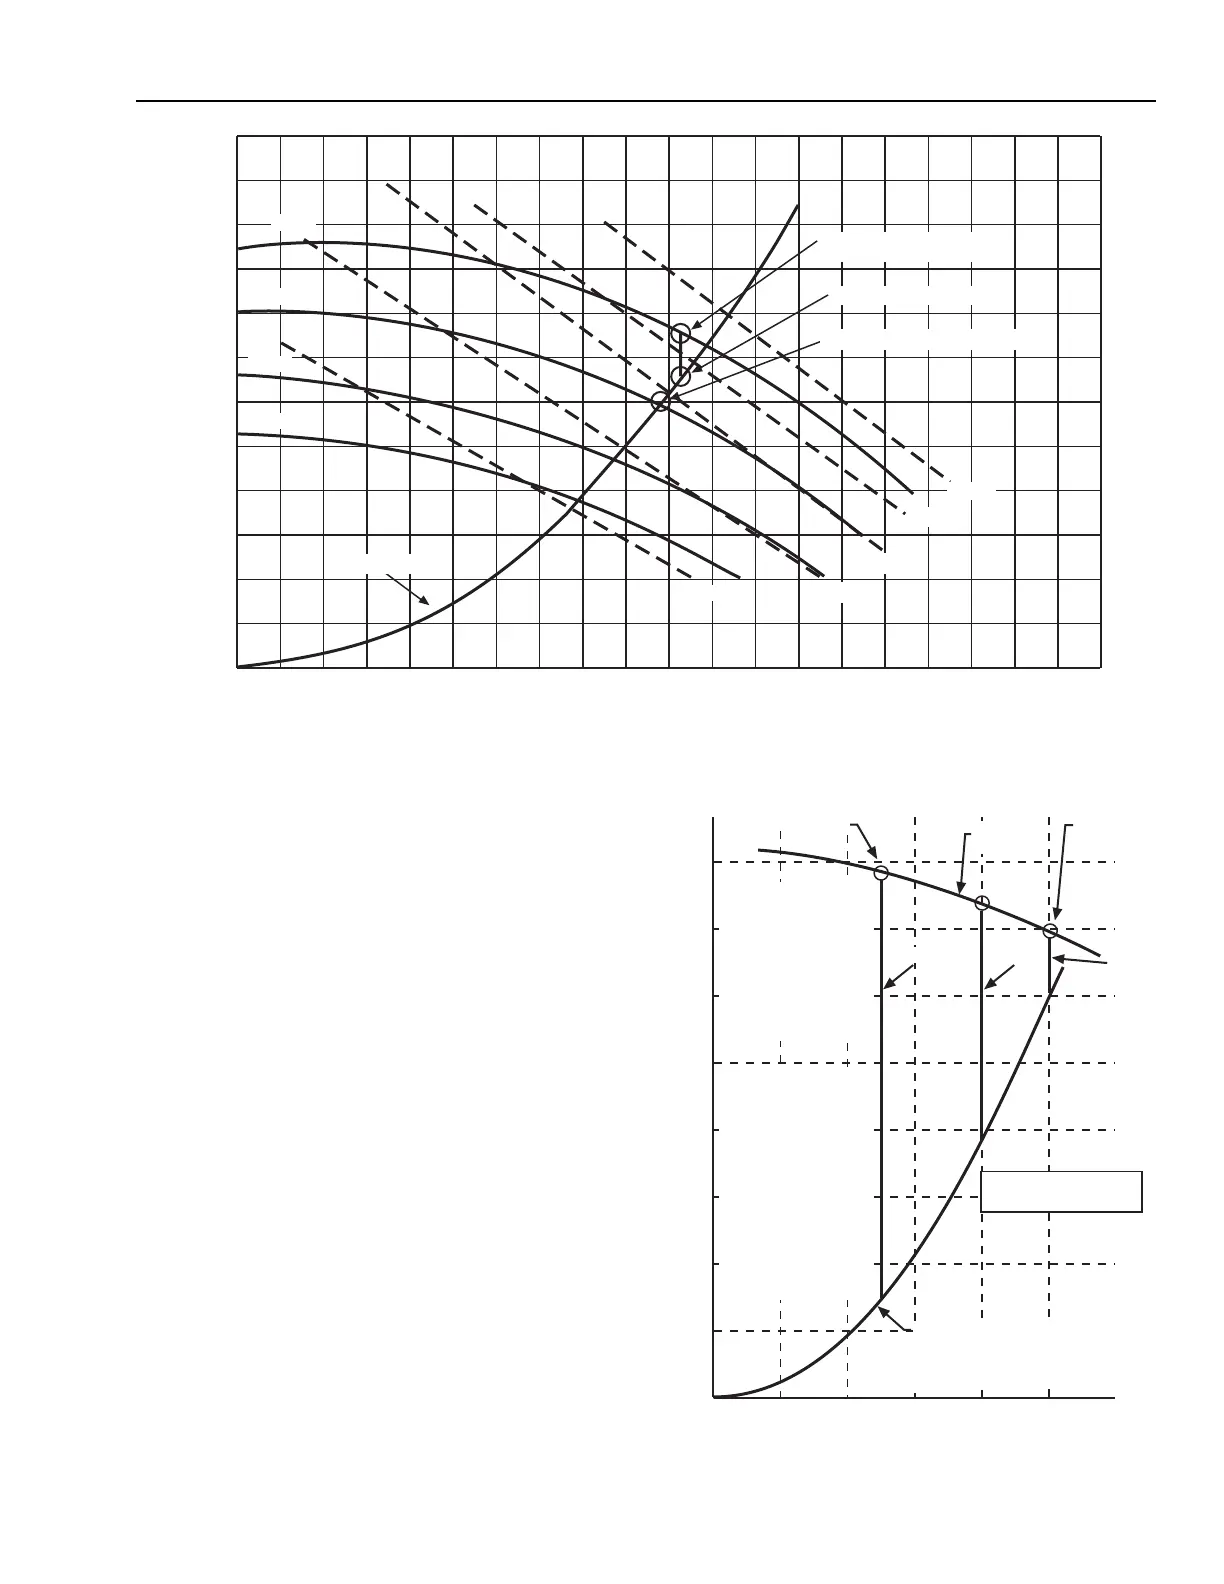
Fig. 58. Pump and System Curves and Control Valves
To better understand system curves, pump curves, and flow
control, Figure 58 shows the control valve(s) (the only variable
element of a typical system curve) separately from the rest of
the system elements. Lines are shown for each of three valve
positions; full, 80 percent, and 50 percent flow. These lines,
when added to the curve for all other elements of the system
intersect the pump curve at the corresponding operating point(s).
Figure 58 shows a system with 31.25 L/s and 210 kPa loss at
design, 30 kPa of which is a full open control valve at the end
of the piping run. Line “A” represents the control valve and
connects the pump curve to the static-element system curve. If
all control valves positioned to 80 percent flow, the pump
pressure rises, the static-element system resistance drops, and
the control valve, represented by line “B”, makes the difference;
about 105 kPa. Similarly, at 50 percent flow, the valve drop,
represented by line “C”, accounts for about 220 kPa.
C4093
SYSTEM CURVE
240mm
220mm
200mm
185mm
4000W
5500W
7500W
9000W
11000W
OPERATION WITH 220mm IMPELLER
DESIGN OPERATING POINT
BALANCED OPERATING POINT
WITH 240mm IMPELLER
300
215
240
210
180
150
120
90
60
30
0
0 6.25 12.5 18.75 25 31.25 37.5 43.75 50 56.25
CAPACITY IN (L/s)
TOTALPRESSURE (kPa)
LINE “A” CONTROL VALVE*
FULL OPEN @ DESIGN
30 kPa DROP AT 31.25 L/S
LINE “B” @ 80% FLOW,
CONTROL VALVE TAKES
98 kPa DROP
LINE “C” @ 50% FLOW,
CONTROL VALVE TAKES
189 kPa DROP
* THE LINE “A” VALVE IS
AT THE END OF THE
PIPING RUN, AND THE
SYSTEM CURVE IS FOR
THE REST OF THE
SYSTEM.
IN A BALANCED SYSTEM,
THE SYSTEM CURVE IS
THE SAME AT ANY AIR
HANDLING UNIT, WITH
THE AIR HANDLING UNIT
BALANCING VALVES
MAKING UP FOR ANY
REDUCED PIPING
LOSSES.
SYSTEM CURVE FOR STATIC
ELEMENTS OF SYSTEM (CHILLER,
PIPING, FITTINGS, BALANCING COCK,
COILS, STRAINERS, ETC.)
DESIGN
OPERATING
POINT
OPERATING POINT
@ 50% FLOW
PUMP
CURVE
LINE A
LINE BLINE C
240
210
180
150
120
90
60
30
0
PUMP REQUIRED:
31.25 L/s at 210 kPa
0 6.25 12.5 18.75 25 31.25
M15268
PRESSURE (kPa)
SYSTEM FLOW IN L/s
 Loading...