Page 12-24
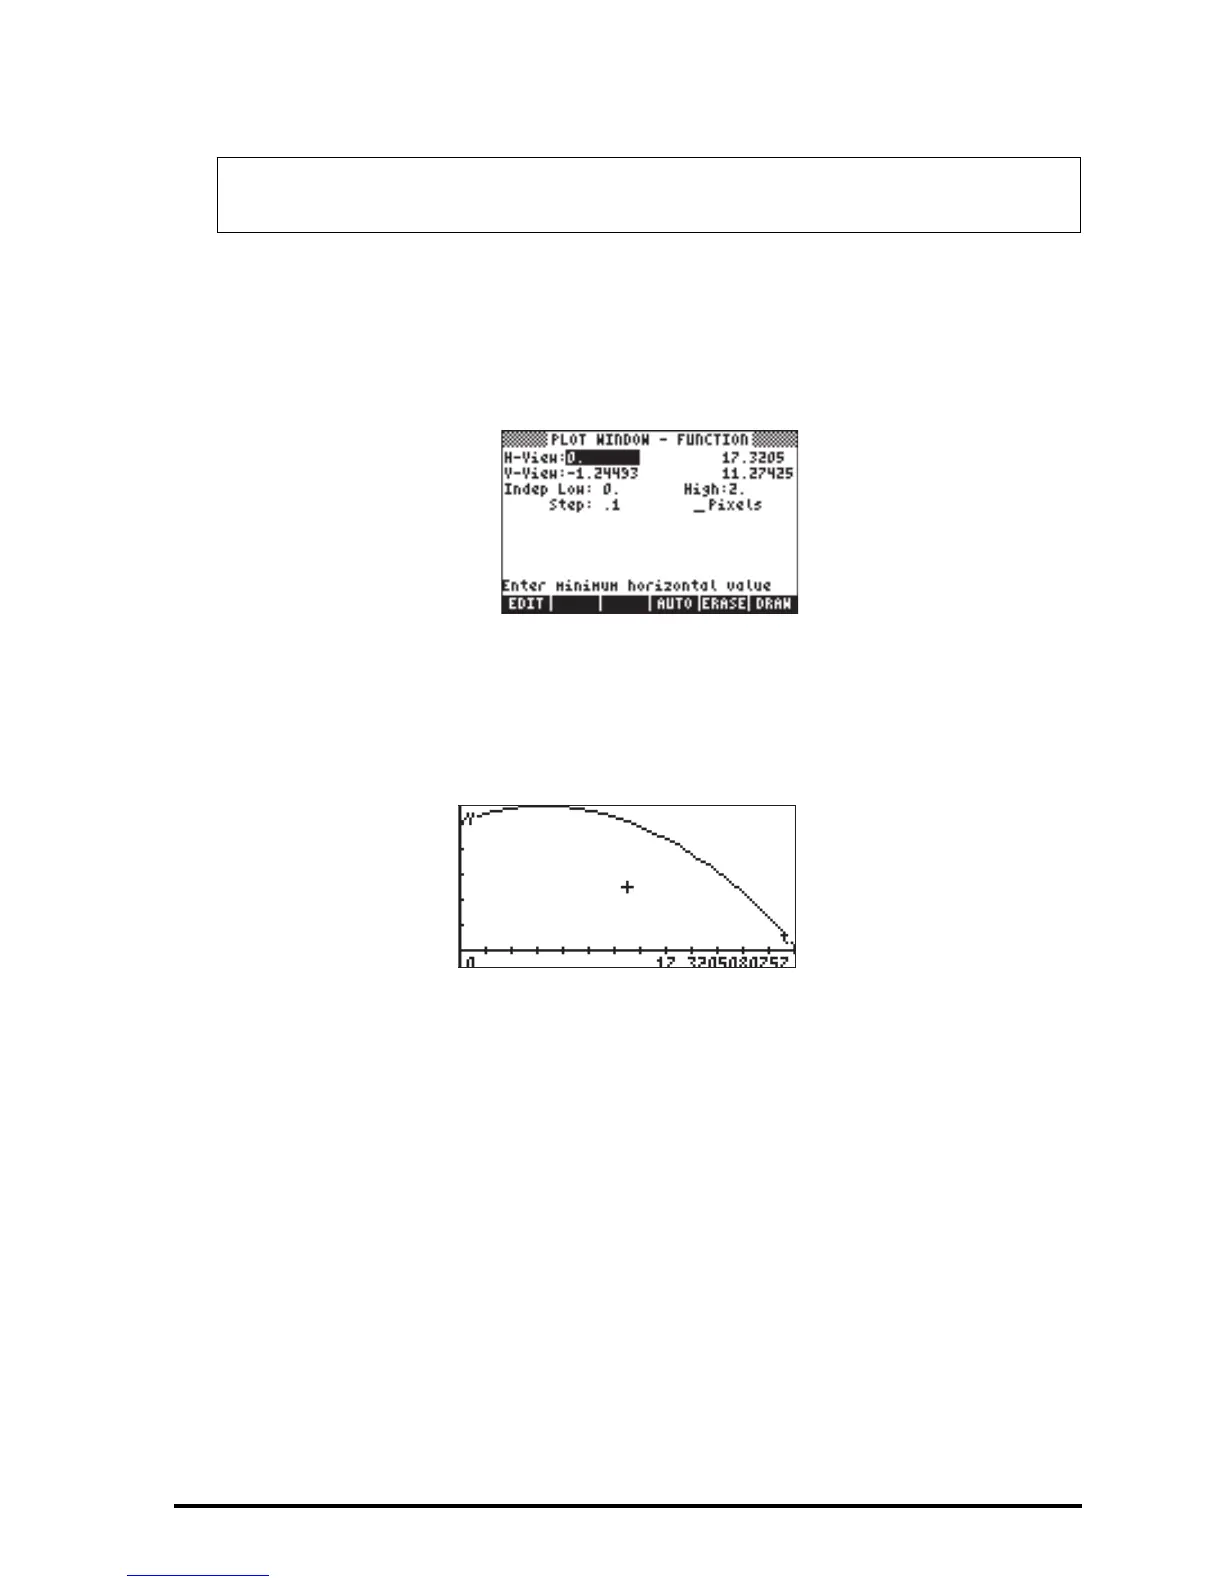
Θ Press @AUTO. This will generate automatic values of the H-View and V-View
ranges based on the values of the independent variable t and the
definitions of X(t) and Y(t) used. The result will be:
Θ Press @ERASE @DRAW to draw the parametric plot.
Θ Press @EDIT L @LABEL @MENU to see the graph with labels. The window
parameters are such that you only see half of the labels in the x-axis.
Θ Press L to recover the menu. Press L@)PICT to recover the original
graphics menu.
Θ Press TRACE @(X,Y)@ to determine coordinates of any point on the graph.
Use ™ and š to move the cursor about the curve. At the bottom of the
screen you will see the value of the parameter t and coordinates of the
cursor as (X,Y).
Θ Press L@CANCL to return to the PLOT WINDOW environment. Then, press
$ , or L@@@OK@@@, to return to normal calculator display.
A review of your soft menu key labels shows that you now have the following
variables: t, EQ, PPAR, Y, X, g, θ0, V0, Y0, X0. Variables t, EQ, and PPAR are
generated by the calculator to store the current values of the parameter, t, of the
equation to be plotted EQ (which contains ‘X(t) + I∗Y(t)’), and the plot
Note: Through these settings we are indicating that the parameter t will
take values of t = 0, 0.1, 0.2, …, etc., until reaching the value of 2.0.

 Loading...


