Page 18-10
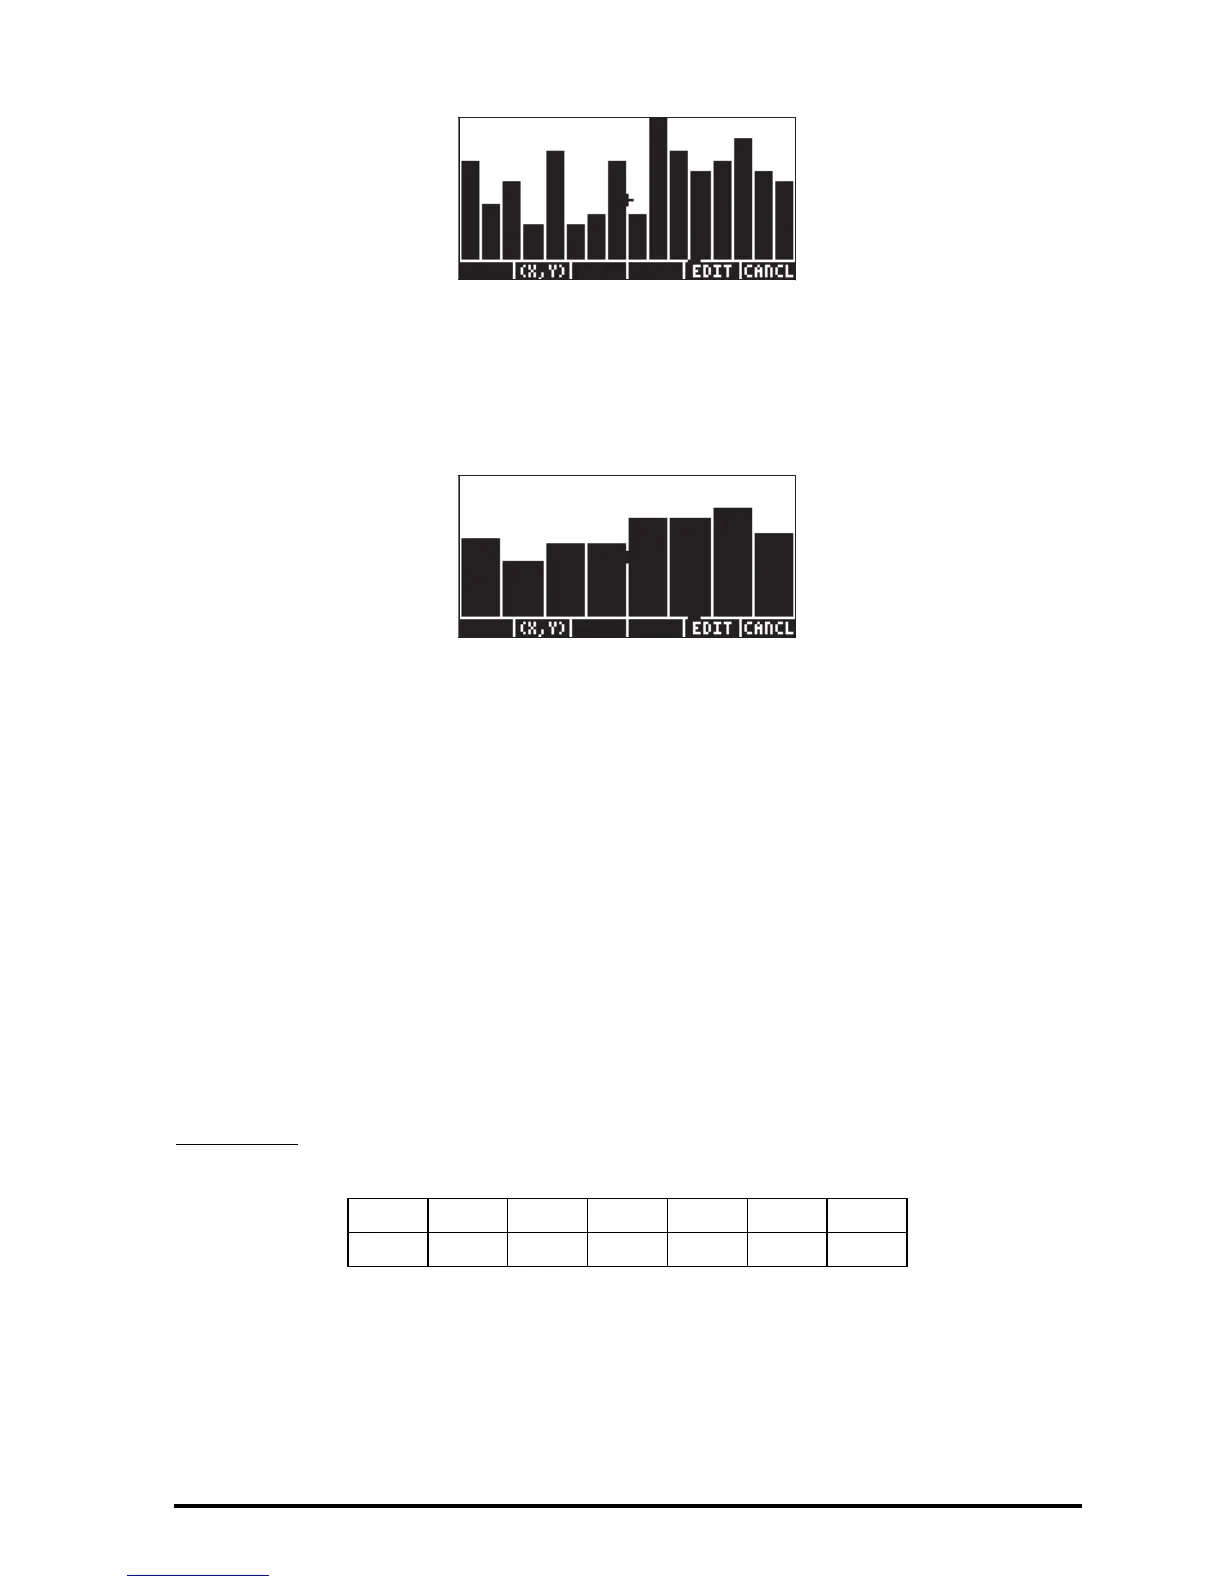
Θ Press @CANCEL to return to the previous screen. Change the V-view and Bar
Width once more, now to read V-View: 0 30, Bar Width: 10. The new
histogram, based on the same data set, now looks like this:
A plot of frequency count, f
i
, vs. class marks, xM
i
, is known as a frequency
polygon. A plot of the cumulative frequency vs. the upper boundaries is
known as a cumulative frequency ogive. You can produce scatterplots that
simulate these two plots by entering the proper data in columns 1 and 2 of a
new
ΣDAT matrix and changing the Type: to SCATTER in the PLOT SETUP
window.
Fitting data to a function y = f(x)
The program 3. Fit data.., available as option number 3 in the STAT menu, can
be used to fit linear, logarithmic, exponential, and power functions to data sets
(x,y), stored in columns of the
ΣDAT matrix. In order for this program to be
effective, you need to have at least two columns in your
ΣDAT variable.
Example 1
– Fit a linear relationship to the data shown in the table below:
x 012345
y 0.5 2.3 3.6 6.7 7.2 11