Page 22-26
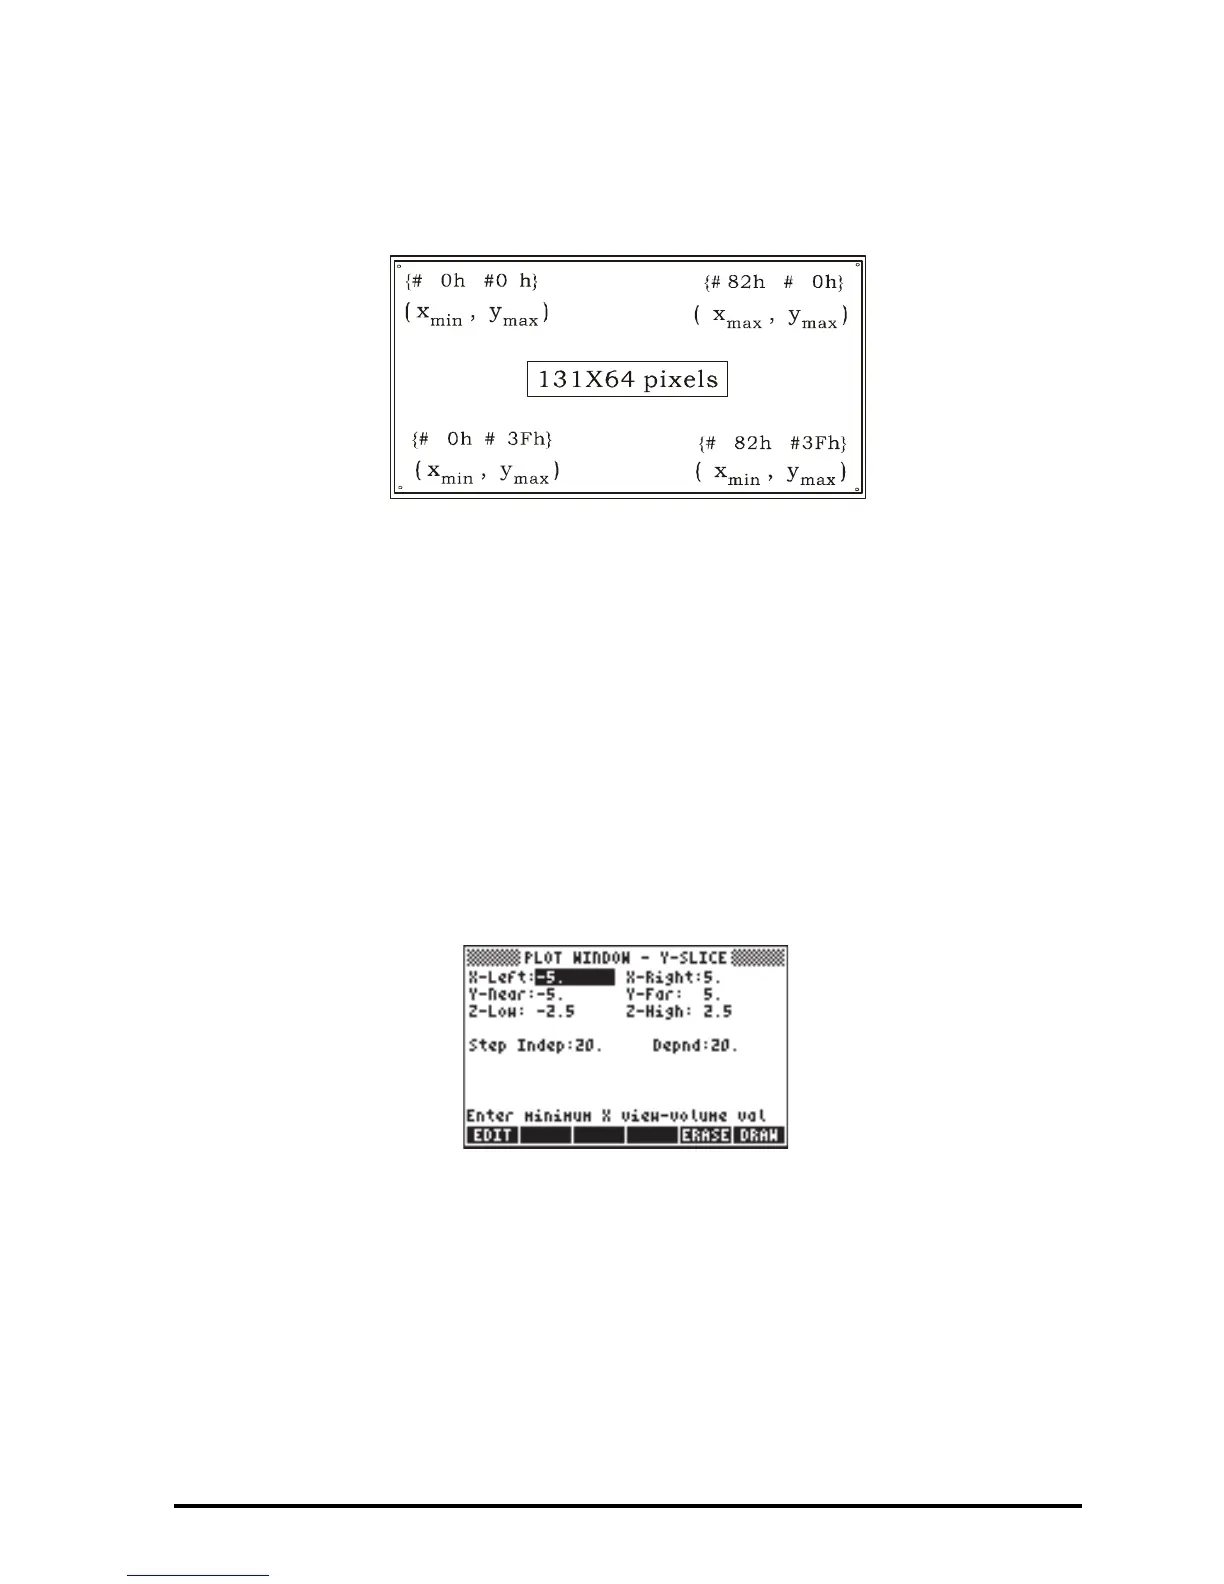
(x
min
, y
max
). The maximum coordinates in terms of pixels correspond to the
lower right corner of the screen {# 82h #3Fh}, which in user-coordinates is the
point (x
max
, y
min
). The coordinates of the two other corners both in pixel as well
as in user-defined coordinates are shown in the figure.
Animating graphics
Herein we present a way to produce animation by using the Y-Slice plot type.
Suppose that you want to animate the traveling wave, f(X,Y) = 2.5 sin(X-Y). We
can treat the X as time in the animation producing plots of f(X,Y) vs. Y for
different values of X. To produce this graph use the following:
Θ „ô simultaneously. Select Y-Slice for TYPE. ‘2.5*SIN(X-Y)’ for
EQ. ‘X’ for INDEP. Press L@@@OK@@@.
Θ „ò, simultaneously (in RPN mode). Use the following values:
Θ Press @ERASE @DRAW. Allow some time for the calculator to generate all the
needed graphics. When ready, it will show a traveling sinusoidal
wave in your screen.