Page 12-30
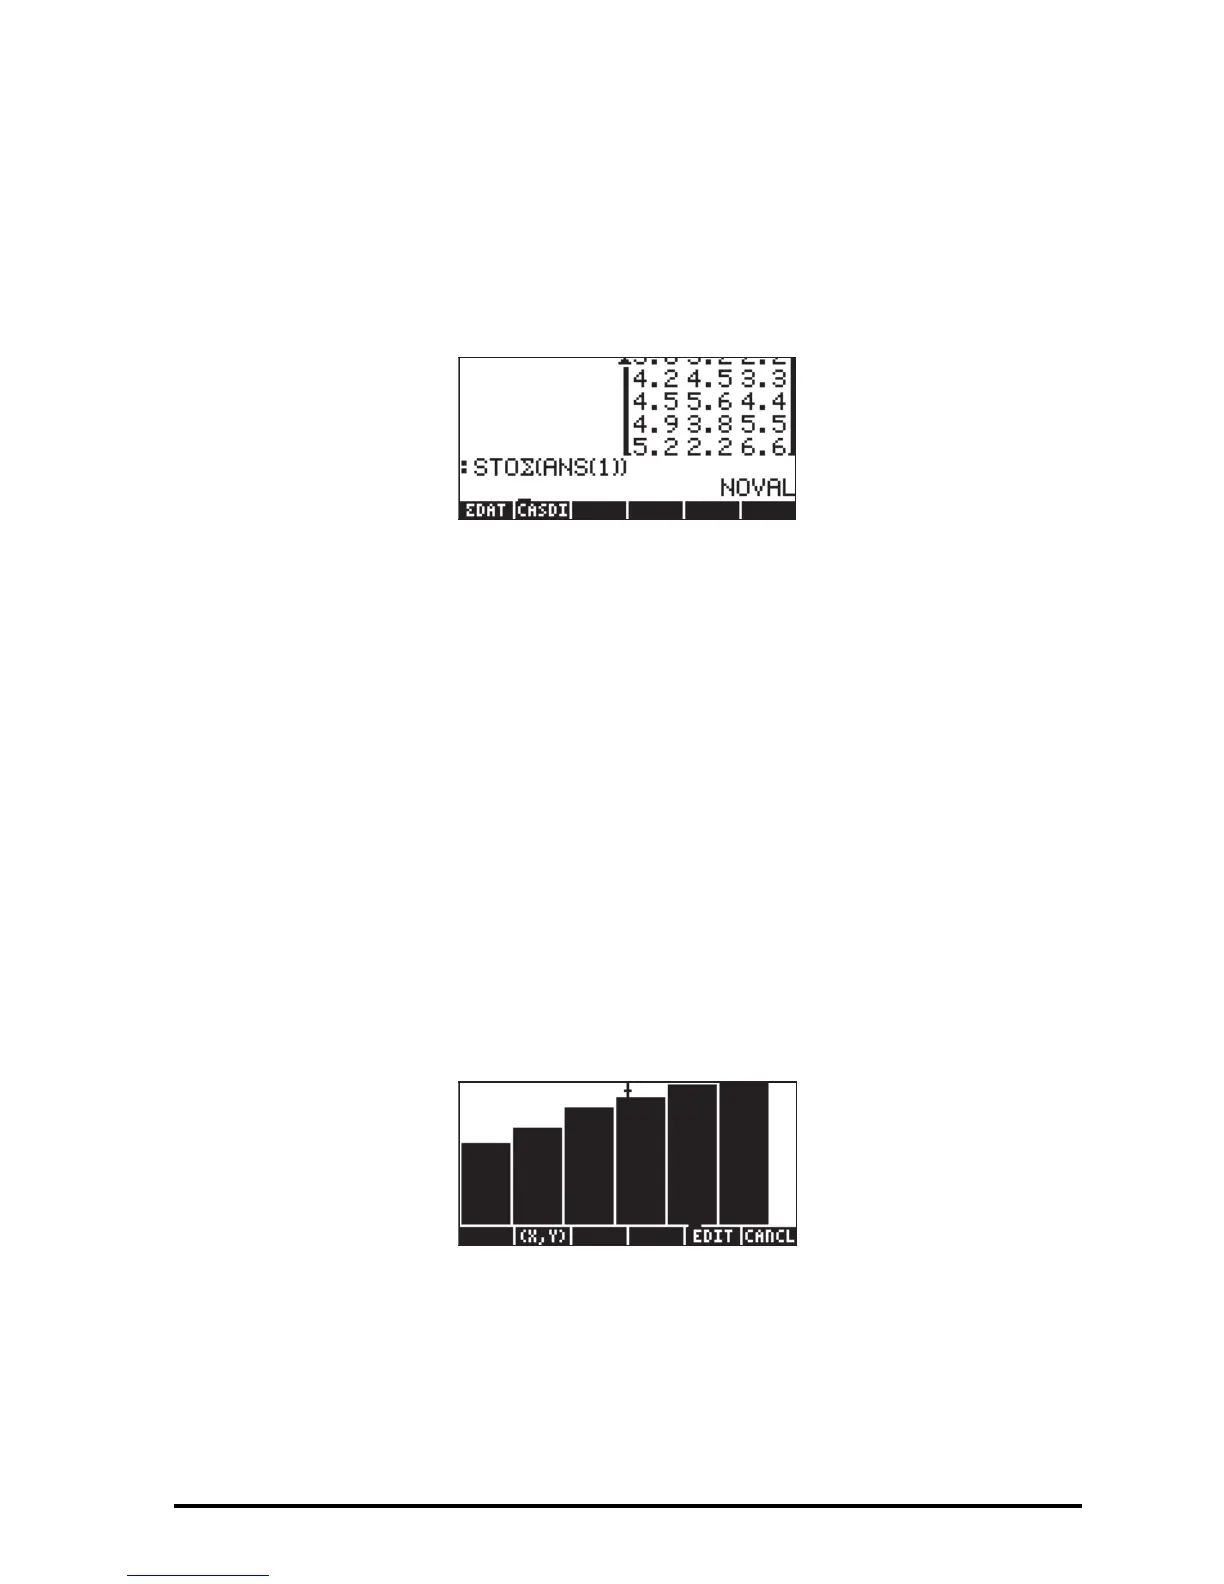
[4.5,5.6,4.4],[4.9,3.8,5.5],[5.2,2.2,6.6]] `
to store it in ΣDAT, use the function STOΣ (available in the function catalog,
‚N). Press VAR to recover your variables menu. A soft menu key
labeled ΣDAT should be available in the stack. The figure below shows the
storage of this matrix in ALG mode:
To produce the graph:
Θ Press „ô, simultaneously if in RPN mode, to access to the PLOT SETUP
window.
Θ Change
TYPE to Bar.
Θ A matrix will be shown at the ΣDAT field. This is the matrix we stored
earlier into ΣDAT.
Θ Highlight the
Col: field. This field lets you choose the column of ΣDAT that
is to be plotted. The default value is 1. Keep it to plot column 1 in ΣDAT.
Θ Press L@@@OK@@@ to return to normal calculator display.
Θ Press „ò, simultaneously if in RPN mode, to access the PLOT
WINDOW screen.
Θ Change the V-View to read,
V-View: 0 5.
Θ Press @ERASE @DRAW to draw the bar plot.
Θ Press @CANCL to return to the PLOT WINDOW environment. Then, press
$ , or L@@@OK@@@, to return to normal calculator display.
The number of bars to be plotted determines the width of the bar. The H- and V-
VIEW are set to 10, by default. We changed the V-VIEW to better
 Loading...


