Page 12-51
TABVAL(X^2-1,{1, 3}) produces a list of {min max} values of the function in the
interval {1,3}, while SIGNTAB(X^2-1) shows the sign of the function in the
interval (-∞,+), with f(x) > 0 in (-∞,-1), f(x) <0, in (-1,1), and f(x) > 0 in (1,+ ∞).
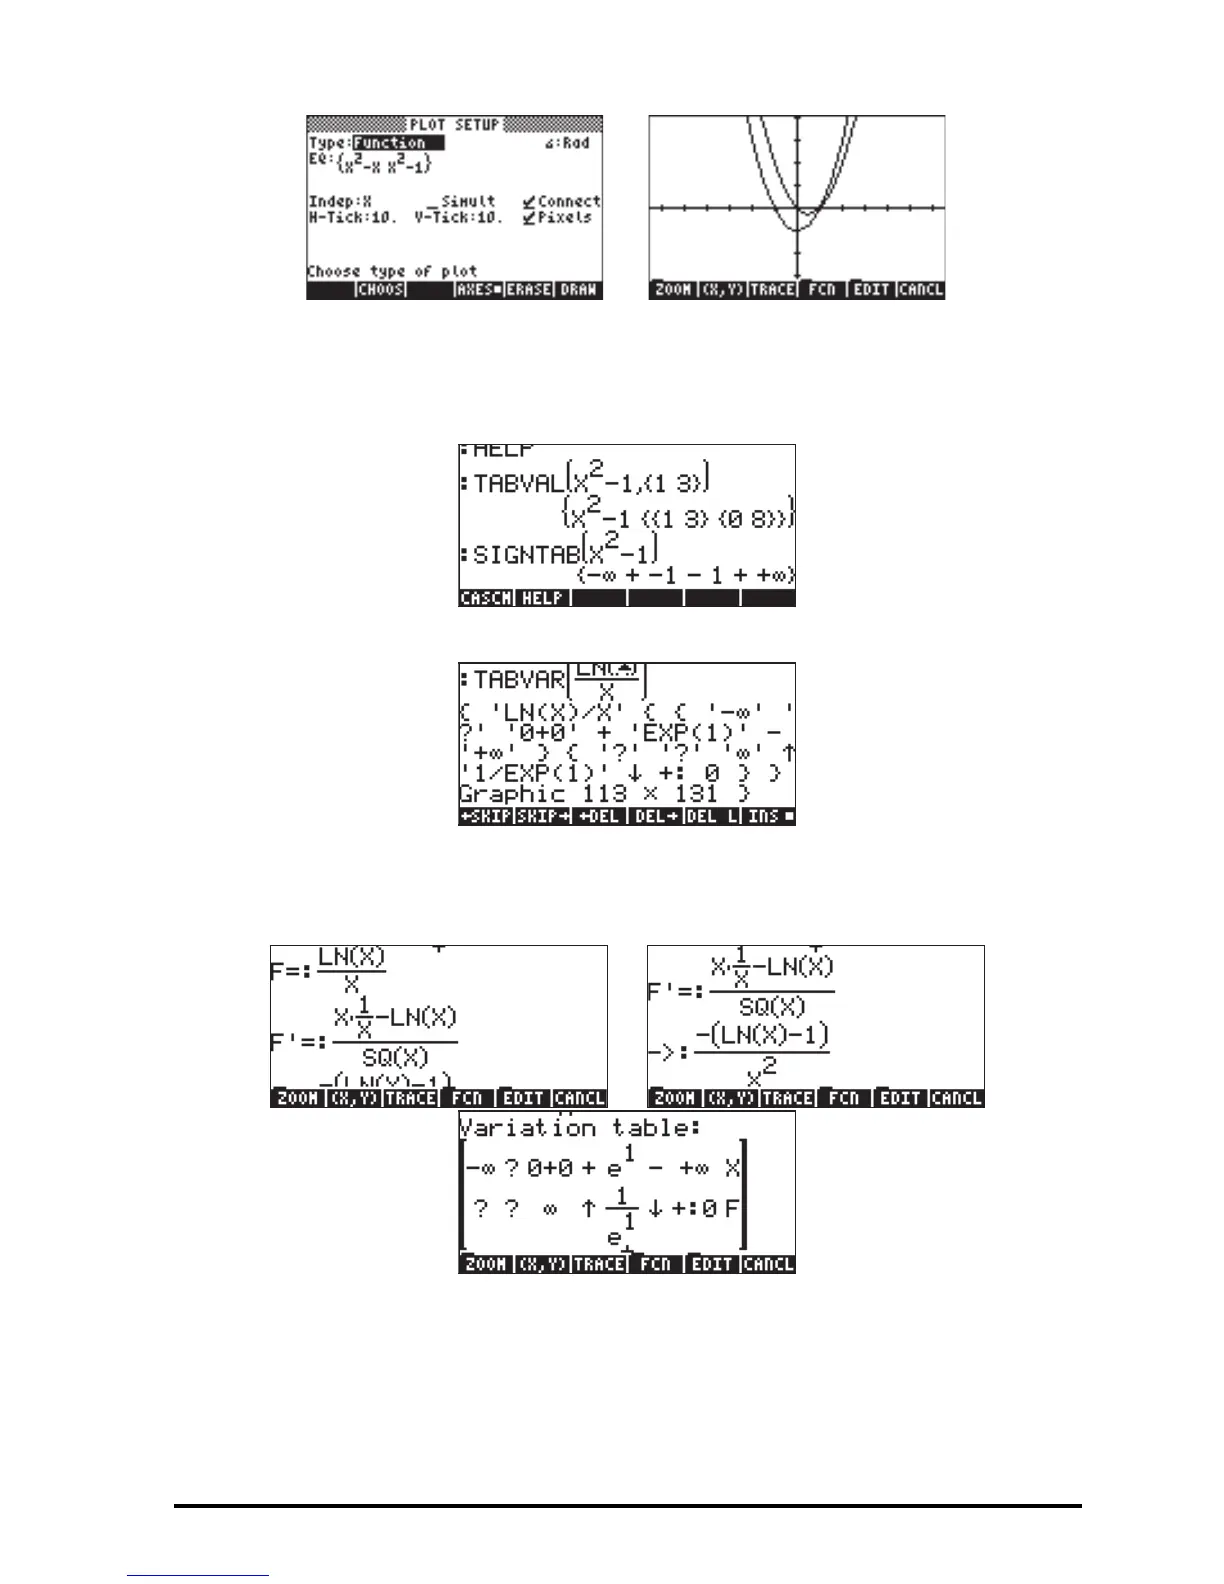
TABVAR(LN(X)/X) produces the following table of variation:
A detailed interpretation of the table of variation is easier to follow in RPN
mode:
The output is in a graphical format, showing the original function, F(X), the
derivative F’(X) right after derivation and after simplification, and finally a table
of variation. The table consists of two rows, labeled in the right-hand side.
Thus, the top row represents values of X and the second row represents values

 Loading...


