Page 16-60
Θ „ô (simultaneously, if in RPN mode) to enter PLOT environment
Θ Highlight the field in front of TYPE, using the —˜keys. Then, press
@CHOOS, and highlight Diff Eq, using the —˜keys. Press @@OK@@.
Θ Change field F: to ‘EXP(- t^2)’
Θ Make sure that the following parameters are set to: H-VAR: 0, V-VAR:
1
Θ Change the independent variable to t .
Θ Accept changes to PLOT SETUP: L @@OK@@
Θ „ò (simultaneously, if in RPN mode). To enter PLOT WINDOW
environment
Θ Change the horizontal and vertical view window to the following settings:
H-VIEW: -1 5; V-VIEW: -1 !!!!1.5
Θ Also, use the following values for the remaining parameters: Init: 0, Final:
5, Step: Default, Tol: 0.0001, Init-Soln: 0
Θ To plot the graph use: @ERASE @DRAW
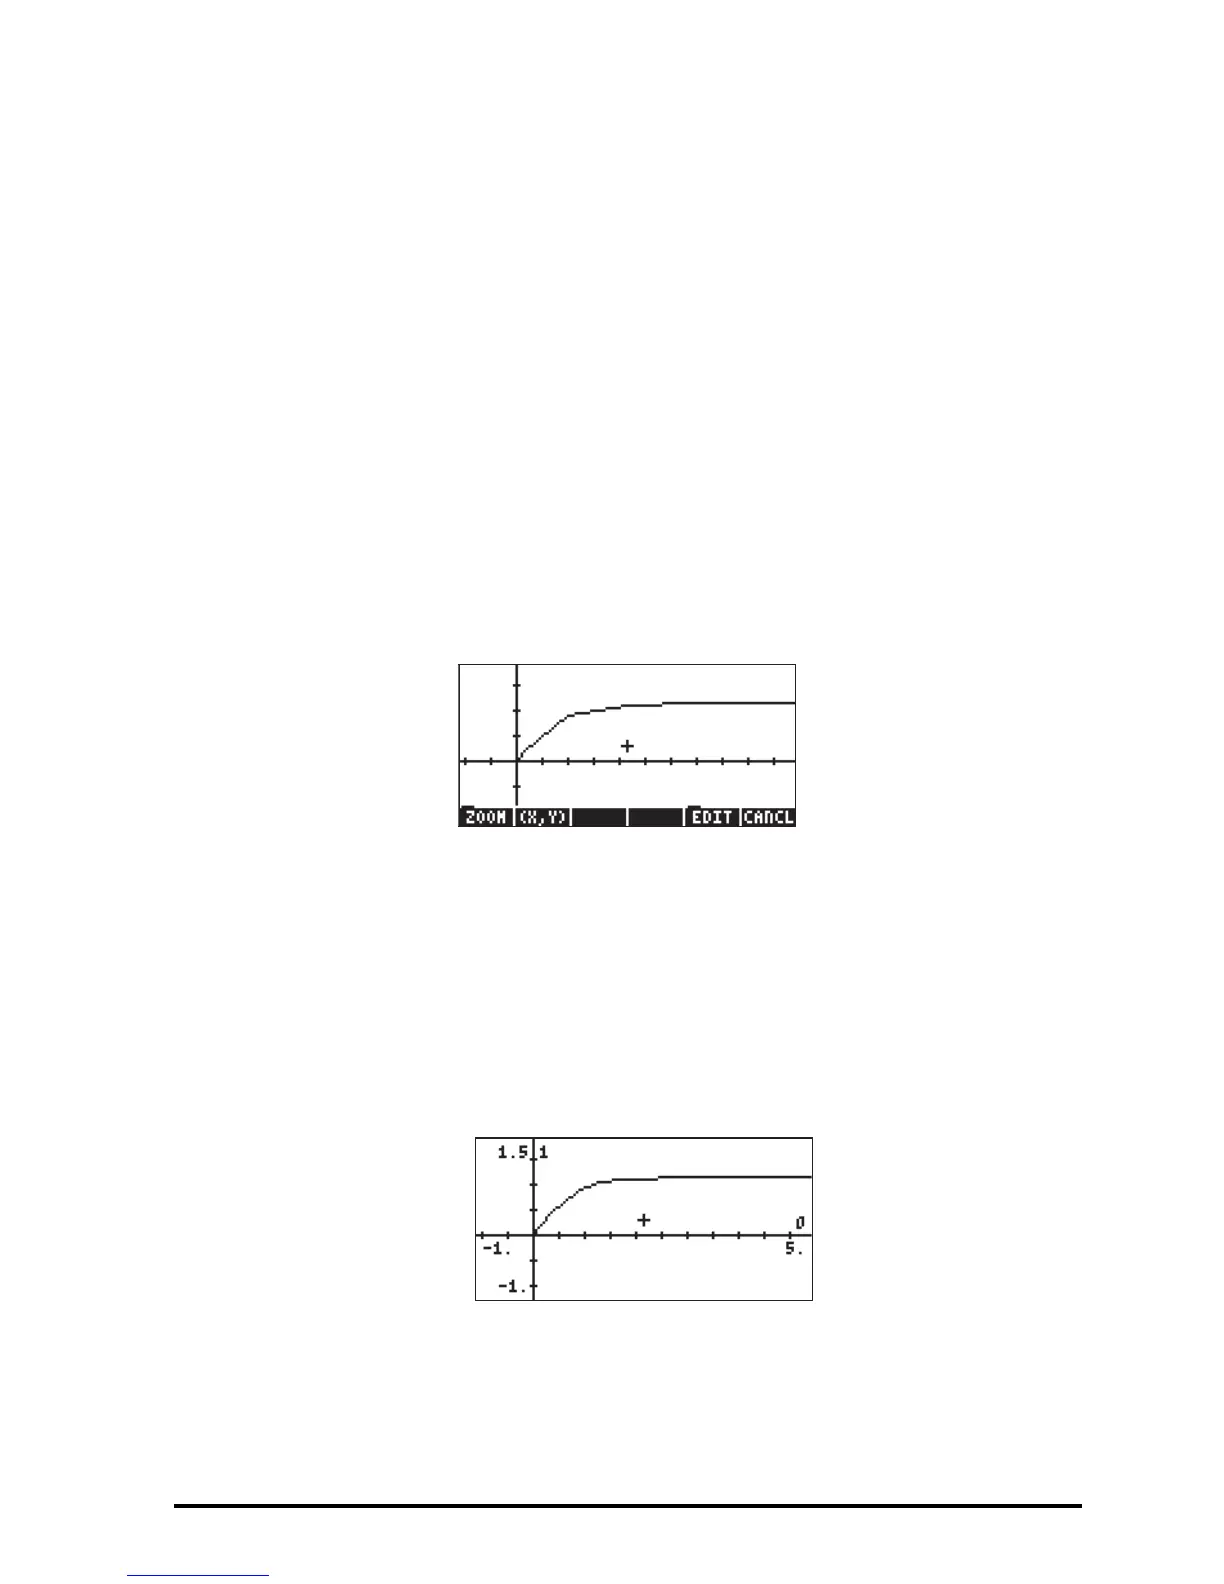
When you observe the graph being plotted, you'll notice that the graph is not
very smooth. That is because the plotter is using a time step that may be a bit
large for a smooth graph. To refine the graph and make it smoother, use a step
of 0.1. Press @CANCL and change the Step : value to 0.1, then use @ERASE @DRAW
once more to repeat the graph. The plot will take longer to be completed, but
the shape is definitely smoother than before. Try the following: @EDIT L @LABEL
@MENU to see axes labels and range.
Notice that the labels for the axes are shown as 0 (horizontal, for t) and 1
(vertical, for x). These are the definitions for the axes as given in the PLOT
SETUP window („ô) i.e., H-VAR: 0, and V-VAR: 1. To see the graphical
solution in detail use the following:

 Loading...


