Page 16-64
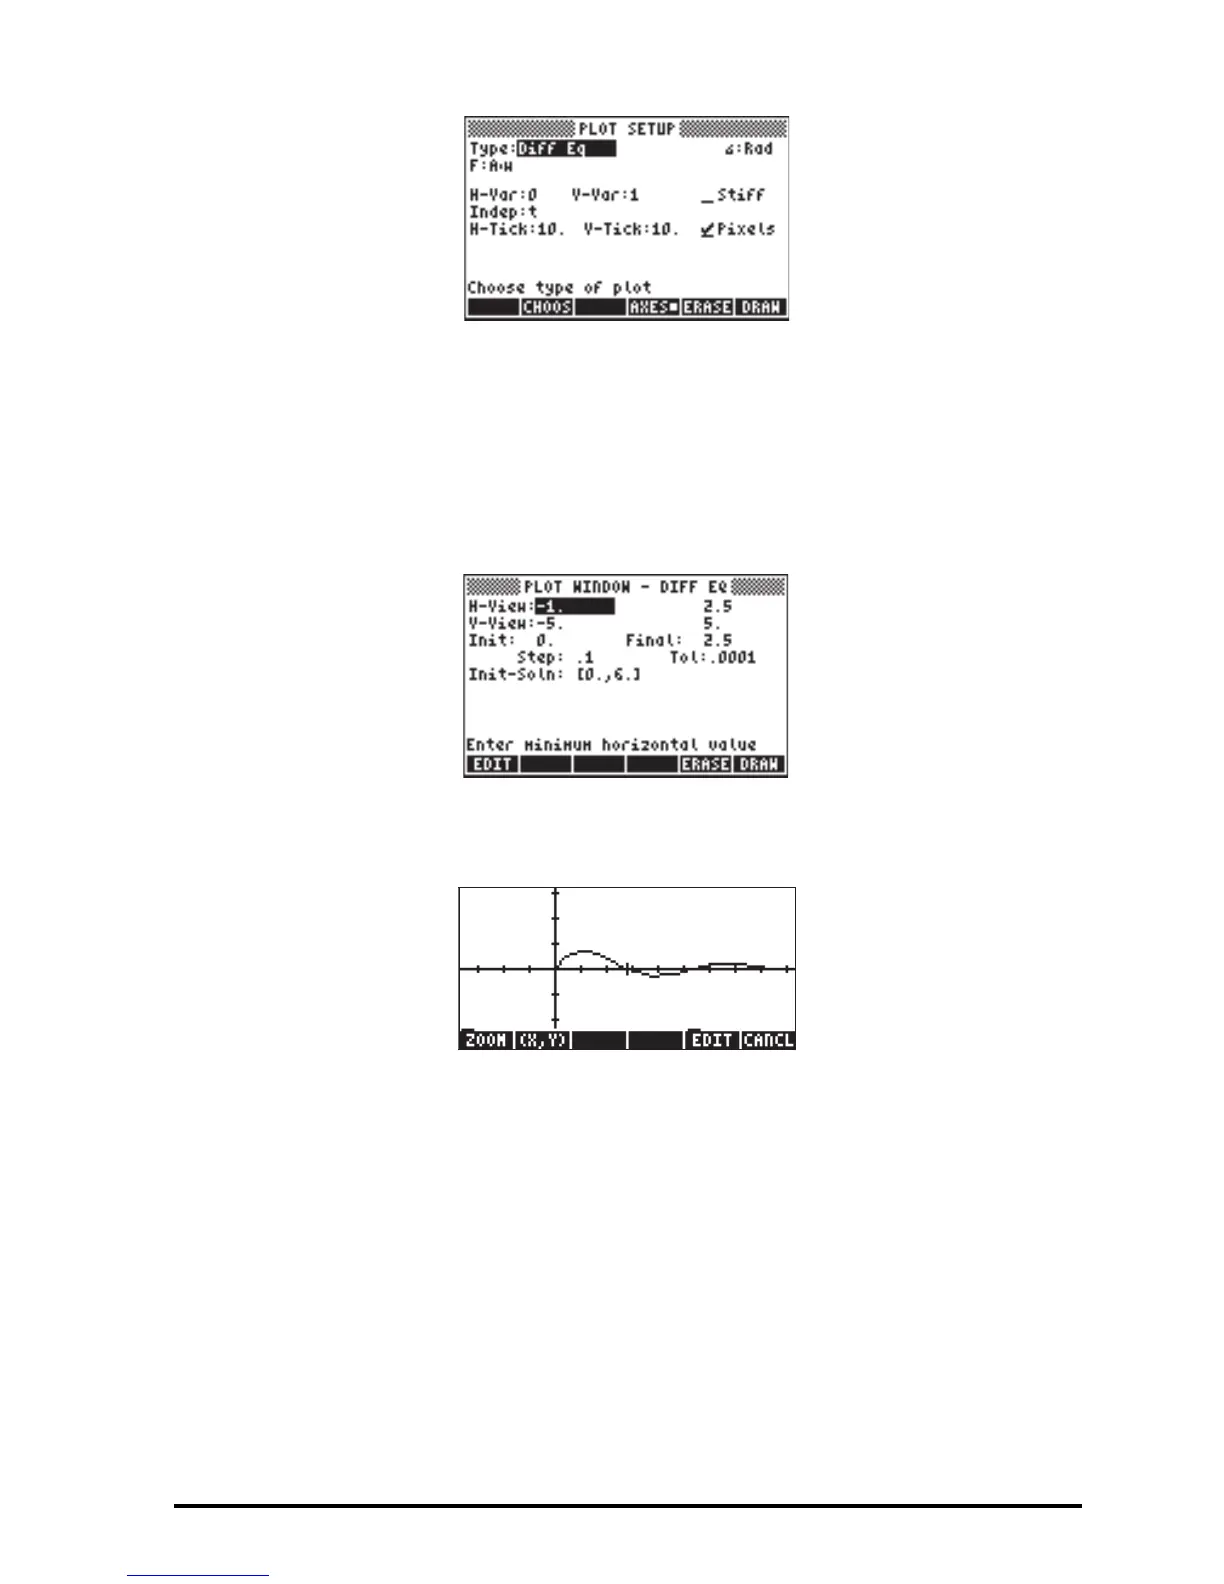
Notice that the option V-Var: is set to 1, indicating that the first element in the
vector solution, namely, x’, is to be plotted against the independent variable t.
Accept changes to PLOT SETUP by pressing L @@OK@@.
Press „ò (simultaneously, if in RPN mode) to enter the PLOT WINDOW
environment. Modify this input form to look like this:
To plot the x’ vs. t graph use: @ERASE @DRAW . The plot of x’ vs. t looks like this:
To plot the second curve we need to use the PLOT SETUP input form once, more.
To reach this form from the graph above use: @CANCL L @@OK@@
„ô(simultaneously, if in RPN mode) . Change the value of the V-Var: field
to 2, and press @DRAW (do not press @ERASE or you would loose the graph
produced above). Use: @EDIT L @LABEL @MENU to see axes labels and range.
Notice that the x axis label is the number 0 (indicating the independent
variable), while the y-axis label is the number 2 (indicating the second variable,
i.e., the last variable plotted). The combined graph looks like this:

 Loading...


