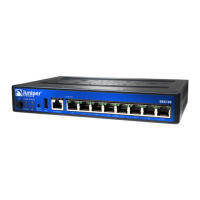
Chapter 14
Monitoring the SRX100 Services Gateway
This chapter includes the following sections:
■ Monitoring the Hardware Components on the SRX100 Services
Gateway on page 79
■ Resetting the Configuration File When the SRX100 Services Gateway Is
Inaccessible on page 85
■ Juniper Networks Technical Assistance Center on page 86
Monitoring the Hardware Components on the SRX100 Services Gateway
This topic includes the following sections:
■ Monitoring the SRX100 Services Gateway Chassis Using the CLI on page 79
■ Monitoring the SRX100 Services Gateway Components Using LEDs on page 81
■ Monitoring the SRX100 Services Gateway Using Chassis Alarm
Conditions on page 83
■ Monitoring the SRX100 Services Gateway Power System on page 84
Monitoring the SRX100 Services Gateway Chassis Using the CLI
You can monitor alarms to troubleshoot hardware problems on a services gateway.
The chassis properties include the status of active chassis alarms on the device and
the environmental measurements of the device.
To view these chassis properties, select Monitor>Chassis in the J-Web interface, or
enter the following CLI show commands:
■ show chassis hardware
■ show chassis environment
■ show chassis fpc
■ show chassis alarms
Monitoring the Hardware Components on the SRX100 Services Gateway ■ 79

 Loading...