Optical Backscatter Reflectometer 4600 49
User Guide
Impo
rta
n
t
When calculating Sensing curves, the Sensing Range
used must begin in a region of zero temperature or strain
difference between the reference and measurement files.
This is necessary to align the measurement files for
spectral and temporal correlations. Similarly, Spot Scans
must begin in a region of zero temperature or strain
difference between the reference and measurement files.
If the calculation area (i.e. integration width or spot scan
region) does not begin in a region of zero strain or
temperature difference, the correlation algorithms will fail.
This can be witnessed by discontinuous sensing data and
low (> 0.15) spectral shift quality.
4
Temperature Change and Strain Coefficients
The Temperature Change and Strain curves are generated by converting the
Spectral Shift curve from values in GHz to degrees C or microstrain. This
conversion is done using a 4
th
order polynomial fit. The user may specify the
coefficients for this conversion by selecting Options > Temperature and Strain
Coefficients, which calls up the dialog box below.
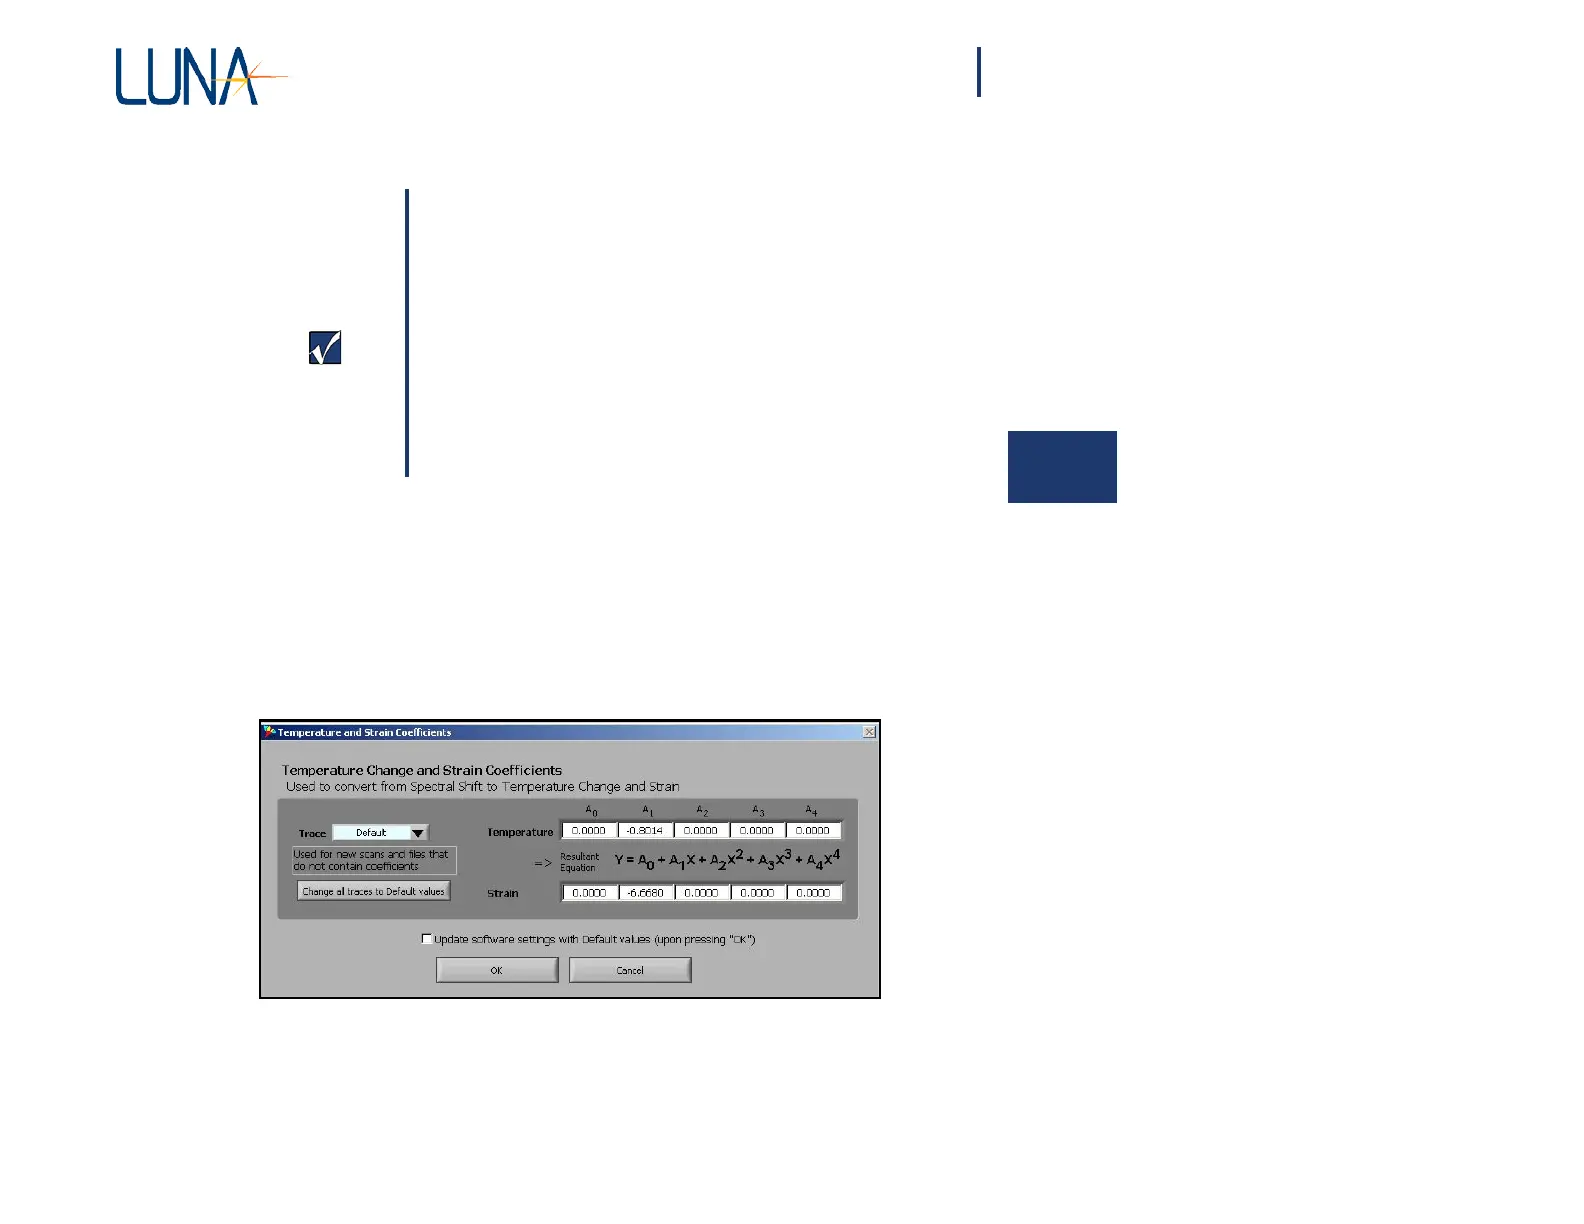
Figure 4-8. Select Options > Temperature and Strain Coefficients to call up this
dialog box. The user-adjustable coefficients control how the software converts
from Spectral Shift to Temperature Change or Strain.
This
window
allows the user to
specify
the
coefficients
used for each
individual
trace,
and the default coefficients to be used for new scans. When the window is first