Optical Backscatter Reflectometer 4600 67
User Guide
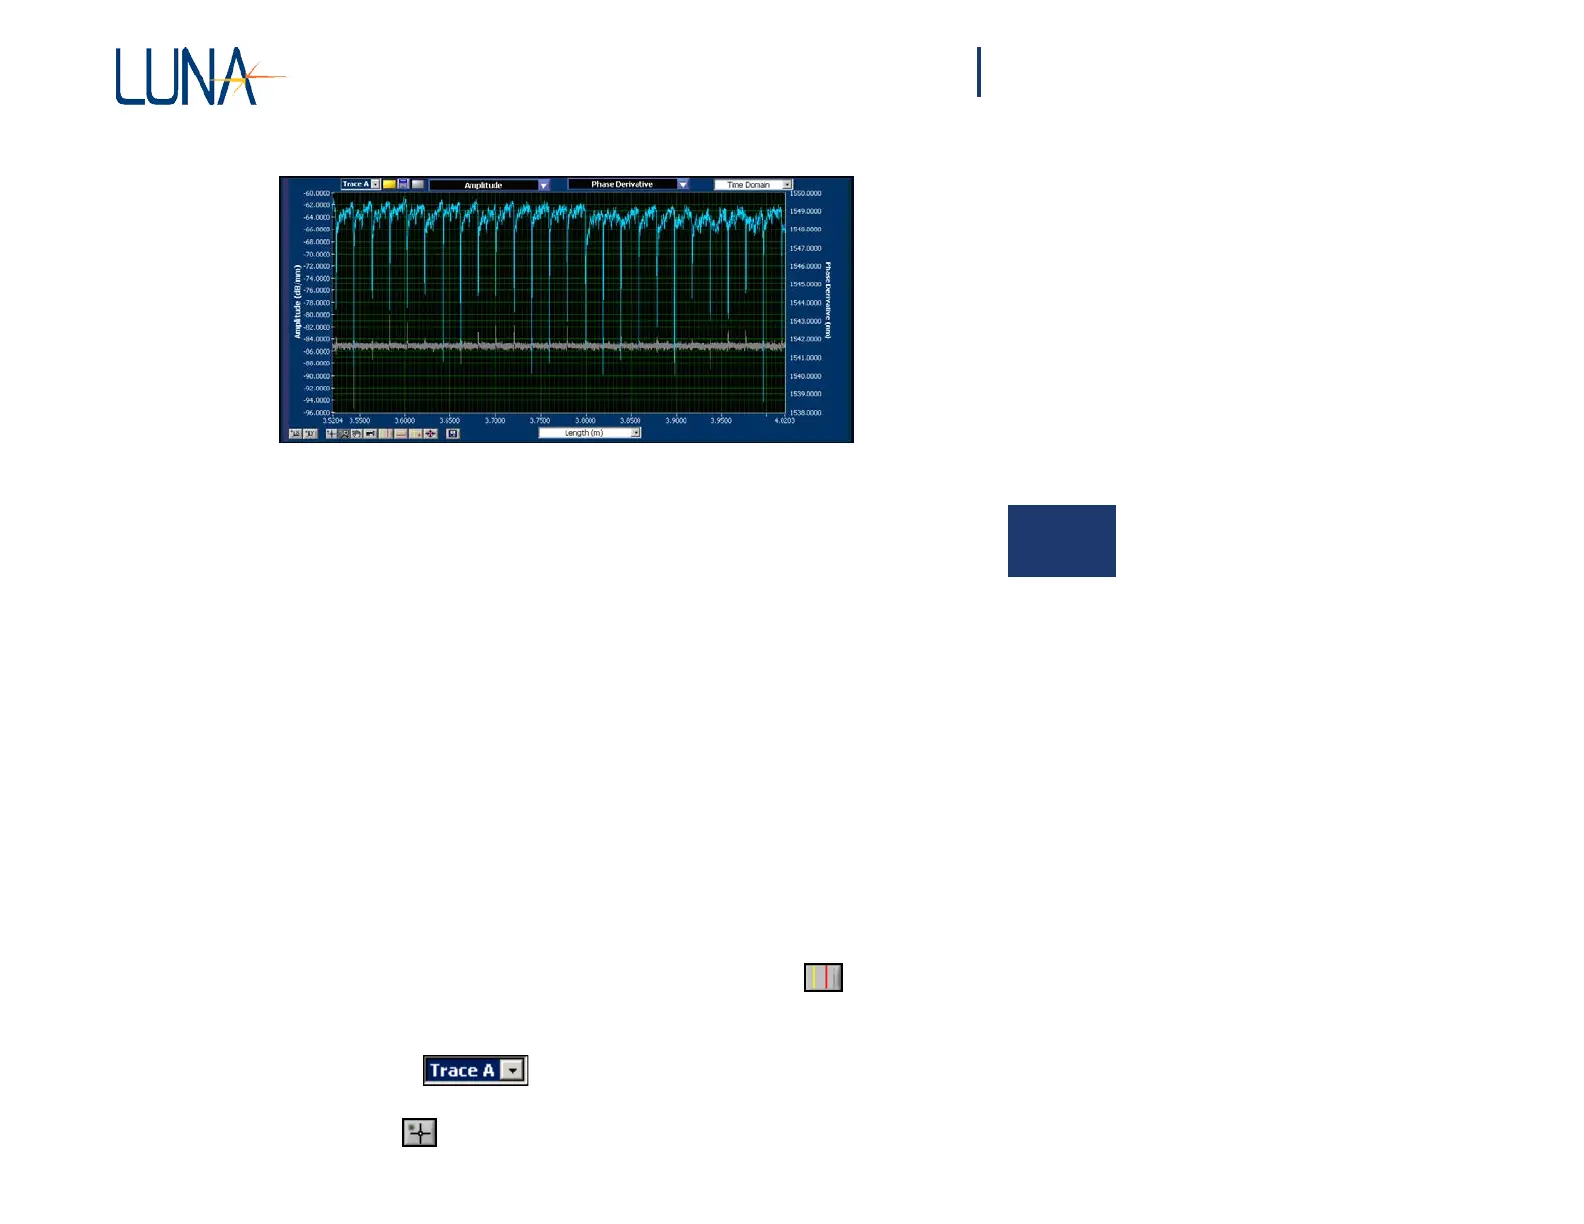
Figure 5-4. The lower graph area can display two parameters at a time if Options >
Lower Graph > Two Plots is enabled (checked).
Manipulating
Plots
5
The OBR control software gives the user great control over the content and
appearance of the data plots. This section covers parameter selection,
zooming, scaling, and cursors.
Updating Lower Graph
The data in the upper graph automatically updates when data is scanned (into
Trace A), moved, or loaded from memory. However, the lower graph will not
update
automatically
unless Options > Display Options >
Auto-Update
Lower
Graph is checked. As mentioned earlier, this is often left off (unchecked) to
speed up scanning time. The lower graph will automatically update after a
Continuous Spot Scan, provided the yellow vertical cursor is located within
the Spot Scan region. (See “Spot Scan Mode” on page 44.)
To update the lower graph
1 Turn on the vertical cursors in the upper graph by clicking .
2 By default, the vertical cursors are attached to Trace A. To attach the
cursors to another trace, select a different trace from the
pull-down
menu
in the Title Bar .
3 Adjust the cursor locations in the upper graph as desired by selecting
the cross-hair tool, then clicking and dragging a cursor.