70 Chapter 5
Data Processing and Display
At other times, the user may rescale each plot axis independently by using the
autoscale buttons for the X-axis and the Y-axis , located in the lower left
corner of each graph window.
Manual scaling
The plot axes may be scaled manually by double-clicking on either the lowest or
highest value labeled on the axis and typing in a new value. To accept the new value,
press enter or click anywhere in the screen.
Note that by using this method it is possible to flip the graph so that increasing values
on the X-axis run from right to left, and increasing values on the Y-axis run from
top to bottom. Typically this is to be avoided, so be sure to enter appropriate values.
Using zoom tools
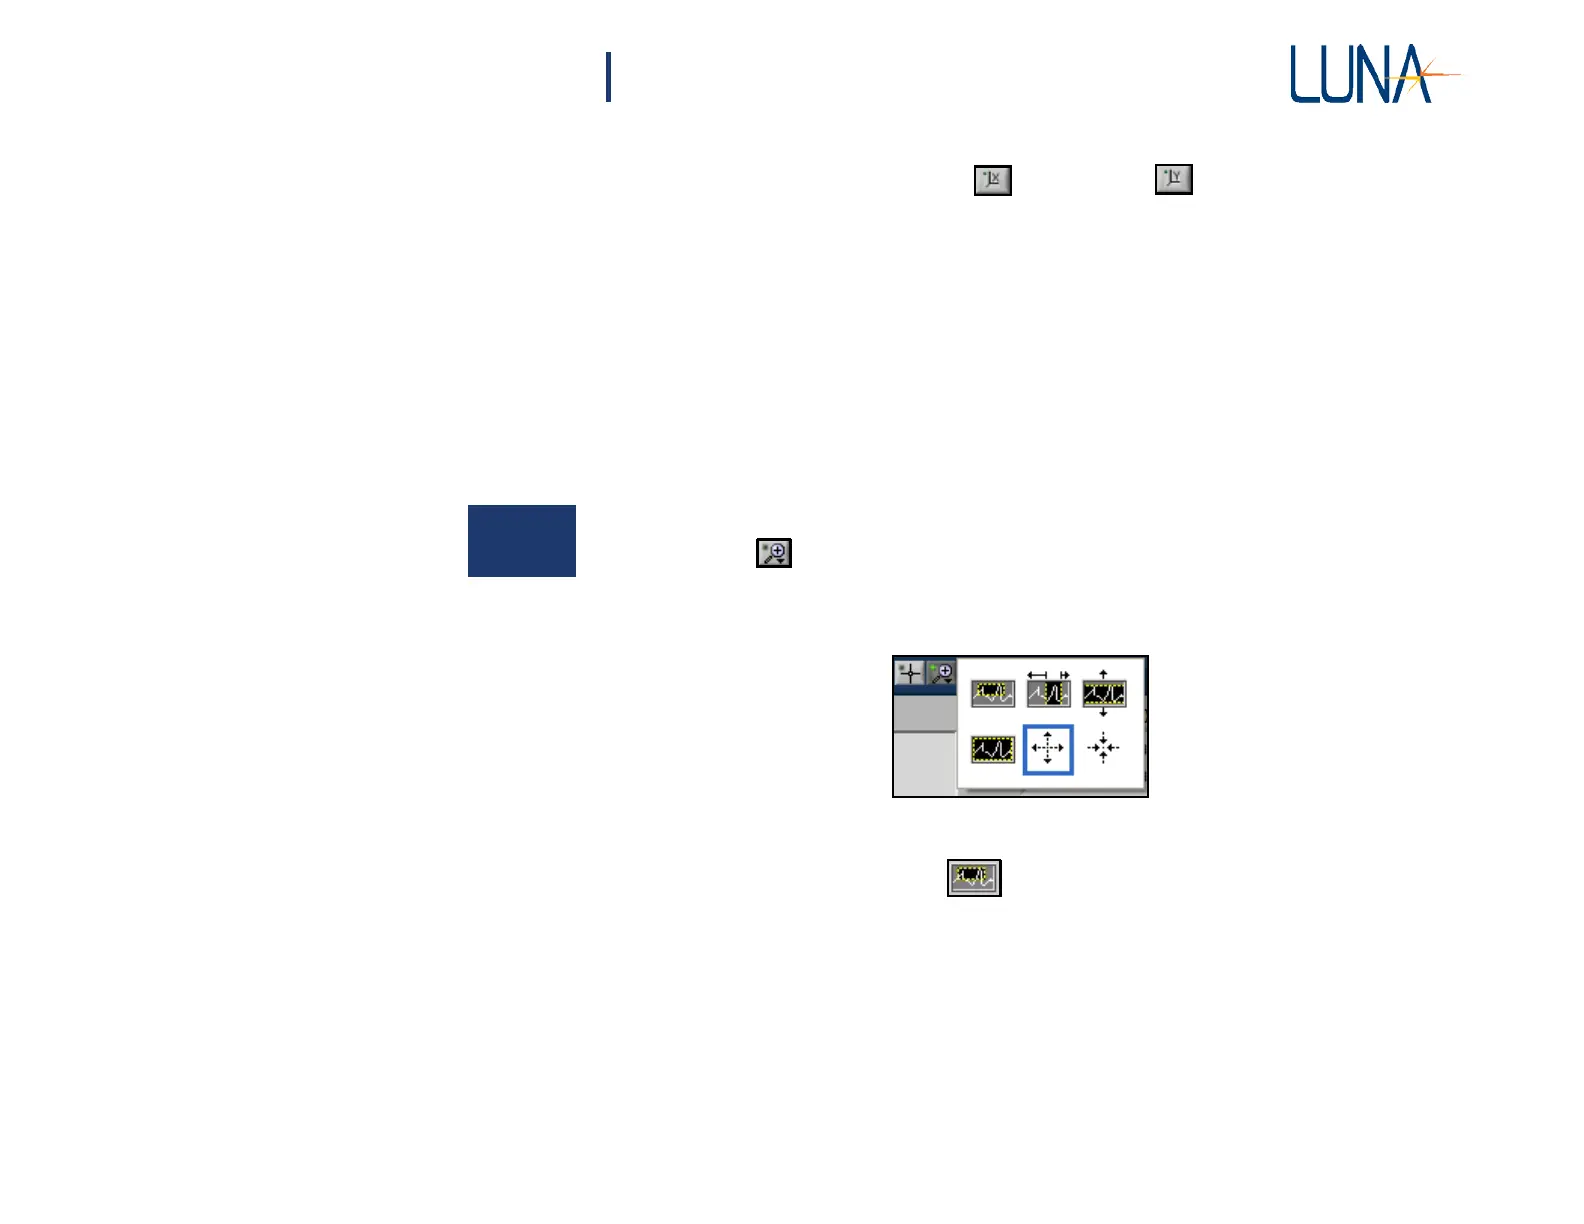
There are six available zoom tools, which are accessible by clicking the zoom menu
button located in the lower left corner of each graph window.
When this button is clicked, a pop-up window containing the six zoom tools opens:
Figure 5-6. Zoom tools pop-up menu. A blue border surrounds the selected tool.
The zoom window
tool:
This tool allows the user to zoom in on a rectangular region of the graph window.
To use this tool, first select it from the zoom menu button. Then click in the graph
window and hold the mouse button to define one corner of the rectangular region.
Then drag the mouse cursor and note that a dotted box appears with corners defined
by the original click position and the current mouse cursor position. Drag the box
around the desired region of the graph window and release the mouse button. Both
the X- and Y-axis scales adjust so that the selected region fills the entire graph
window.