72 Chapter 5
Data Processing and Display
To use this tool, first select it from the zoom menu button. Then click once to zoom
out once; or click, hold and release to zoom out several times at the cursor location.
Using Cursors, Legends and Other Buttons
Cursors
The OBR software offers three types of cursors. By default, vertical cursors and twin
locked
cursors
appear at 10% and 90% of the X-axis range.
Horizontal
cursors appear
at 10% and 90% of the Y-axis range. To move the cursors, select the cross-hair ,
then click, drag, and release the cursor.
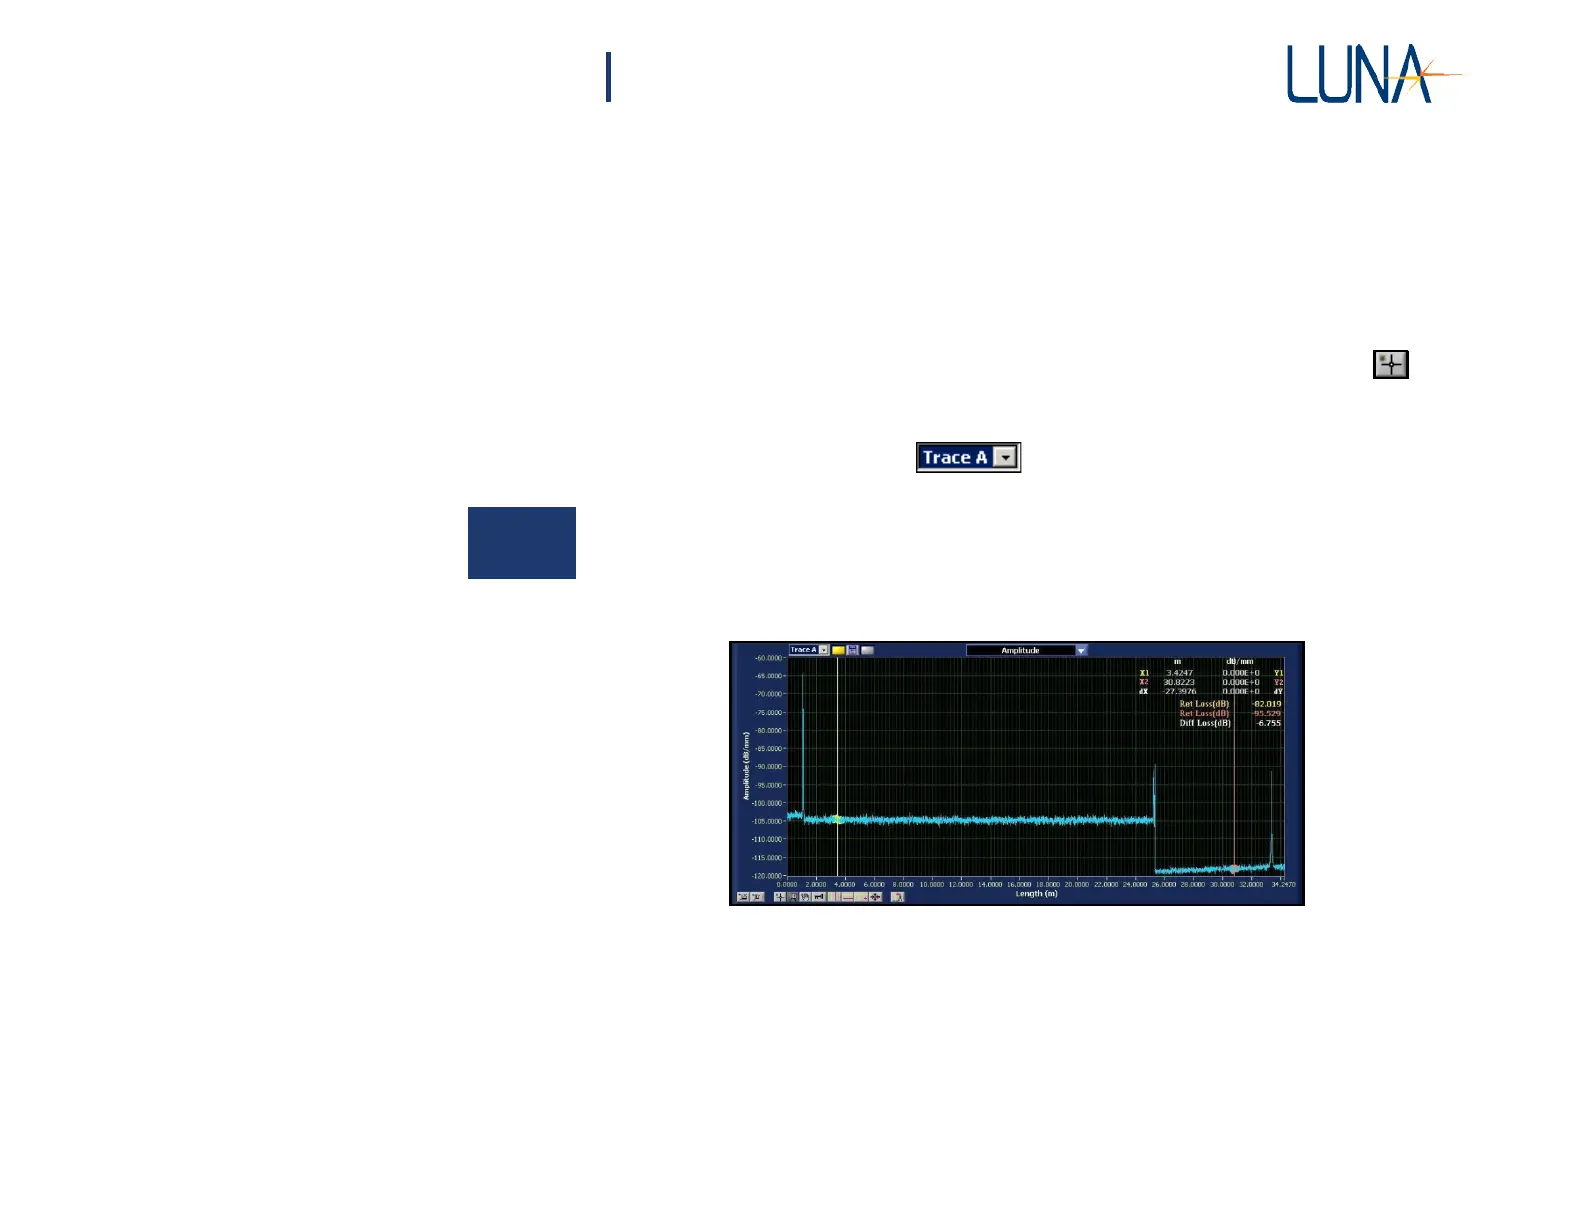
The cursors are attached to Trace A by default. To attach cursors to a different trace,
select that trace from the pull-down menu.
When any of the cursors are on, a legend appears in the upper right corner giving
the exact location of the cursors in the units currently selected. The legend also
indicates the distance between the two cursors (dX for vertical cursors, dY for
horizontal cursors, and dX and dY for twin locked cursors).
Figure 5-7. Upper graph showing the amplitude data with vertical cursors appearing
at the default location. The legend at the upper right gives the precise location
of the cursors and the distance between them (dX in this case). The legend also
displays the return loss at each cursor and the differential loss between the two
cursors. Note that the data points integrated to calculate differential loss are
highlighted in contrasting colors