76 Chapter 5
Data Processing and Display
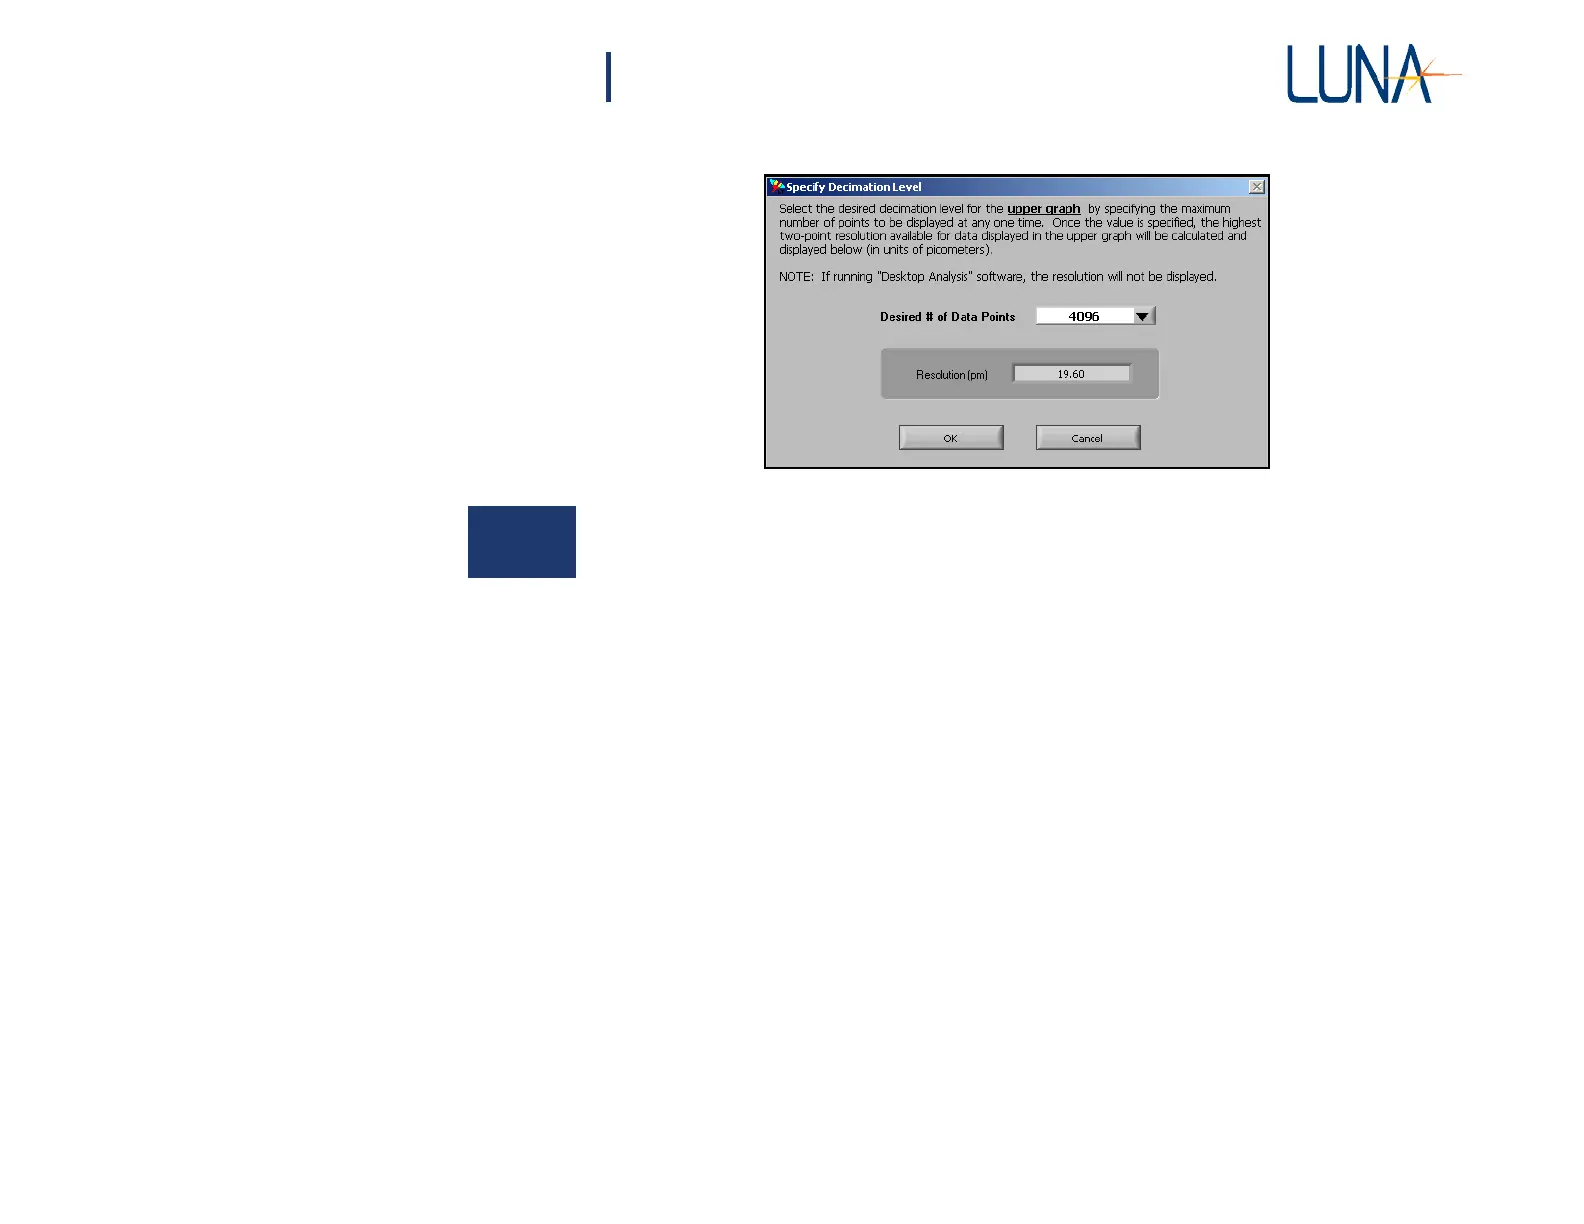
Figure 5-9. The Specify Decimation Level dialog box
allows the user to set the number of data points displayed.
Decimation makes the graphs much less “noisy” and quicker to display. Note that
files saved in the binary (.obr) format contain the raw data, undecimated. Text files
(.txt) may be reduced in size by selecting a smaller number of points to display before
saving. The upper section of a text file notes the data decimation factor.
Adjusting Spatial Resolution
The user may change the Spatial Resolution value in the Data Processing are of
the main screen. If the Spatial Resolution is set below the minimum achievable
resolution, the software will coerce it to the actual minimum value and thus the data
is unfiltered. Setting the control above this value will cause the data to be box-car
filtered with the user-specified bin size equal to the Spatial Resolution. For an
explanation of how this filter is calculated, see “Spatial Resolution Calculations”
on page 178.
Printing Graphs
The user may print both graphs currently displayed by selecting File > Print
Datasheet. The control software prints to any printer defined as the default
Microsoft
®
Windows
®
printer. The graphs will print with the current filter and axis
settings. The legends and cursors will not appear in the printout.