184 Chapter 8
Measurement Theory
where
arg
( z ) denotes the argument (phase) of the complex number z , and ∆ω is
the change in optical frequency from index i to index
i + 1 .
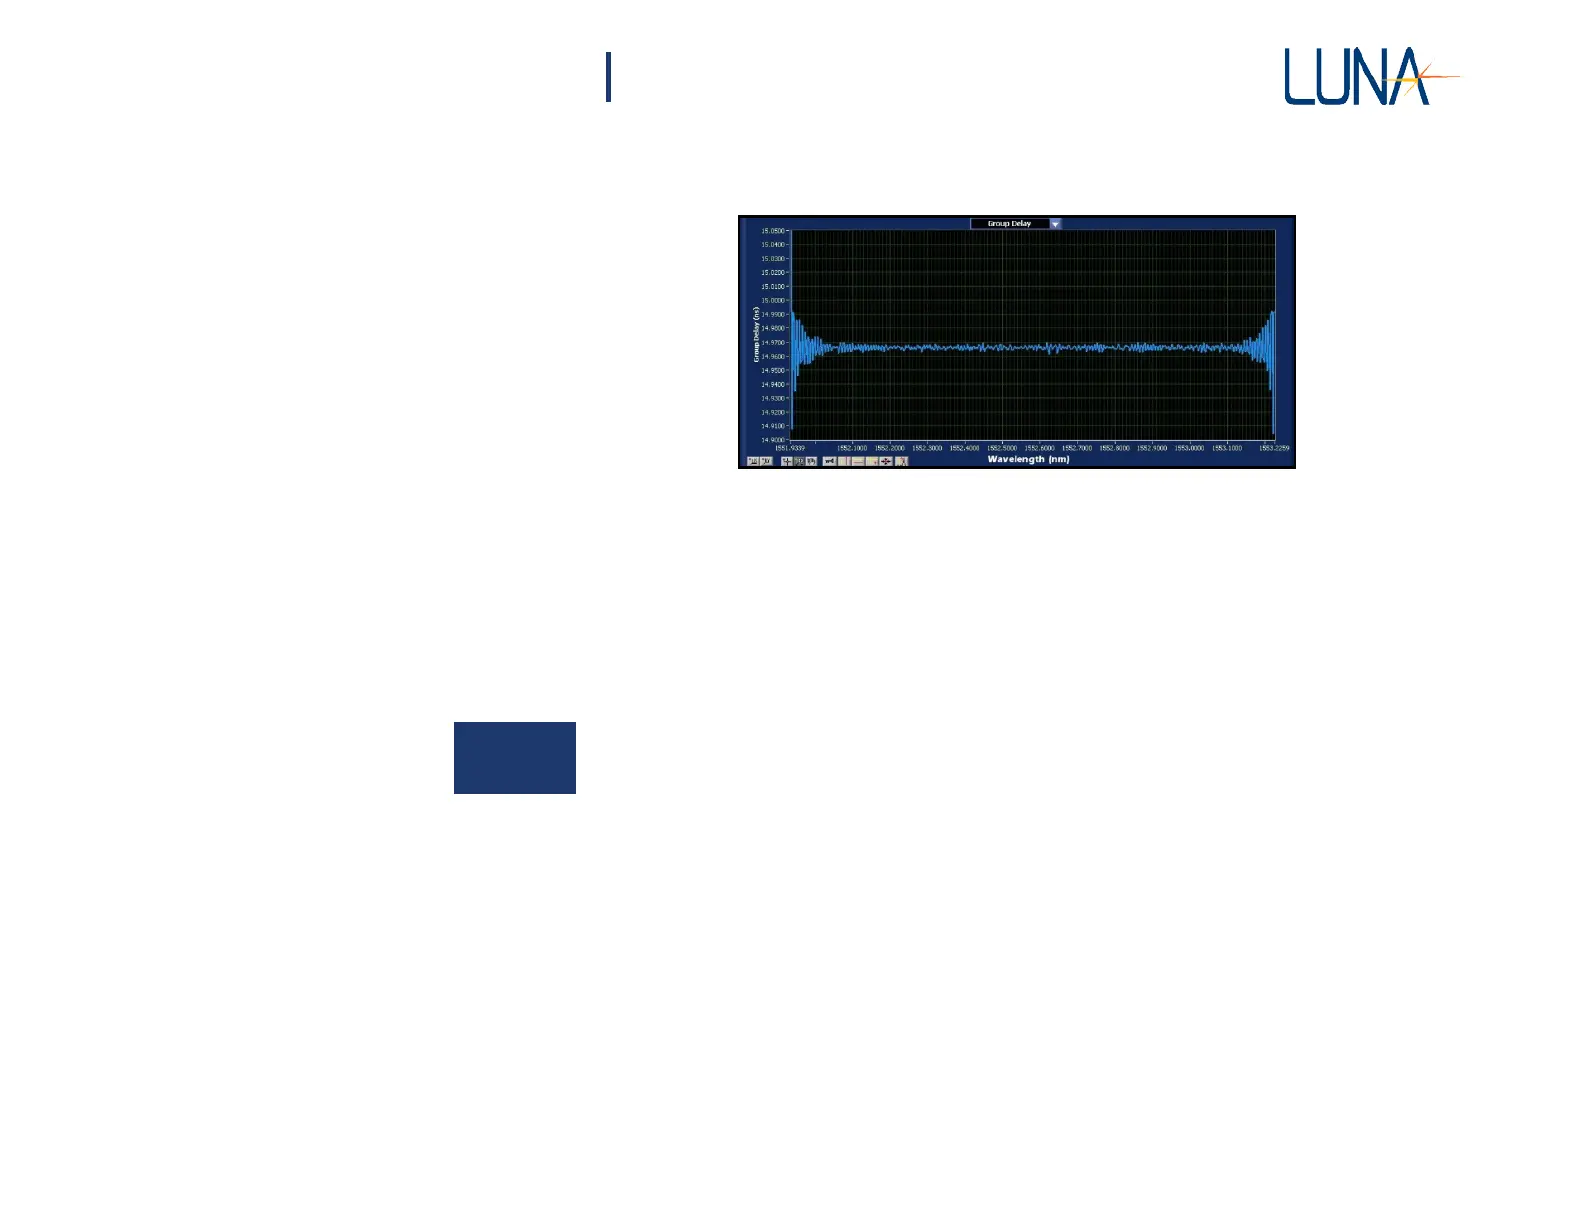
Figure 8-9. Group Delay data for a patch cord.
Frequency Domain Window
Some OBR users have noted that the reflectance peaks from strong reflection events
(generally with higher than -45 dB return loss) exhibit marked broadening at the
base. These side band tails can sometimes obscure the peak of a weak reflector very
near a strong reflector peak. They can also overwhelm the nearby Rayleigh scatter
level, making insertion loss
measurements
near the base of the strong reflection peak
difficult. Using the Frequency Domain Window option significantly diminishes
reflection peak side band tails.
The window is applied to all newly scanned data by selecting Options > Display
Options > Apply Frequency Domain Window. There is no significant scan or
calculation time penalty associated with selecting this option.
The effects of the Frequency Domain Window are illustrated in Figures 8-10 and
8-11. Figure 8-10 shows the reflection trace of a FC/PC connector with a clear plastic
cap covering the ferrule. In the normal trace (blue), the reflections of the end cap
surfaces are barely visible above the side band tail of the connector. Applying the
Frequency Domain Window produces a trace (white) which suppresses the side band
tails and greatly enhances the contrast of the much weaker end cap reflections
just
a
few millimeters away from the connector.