Optical Backscatter Reflectometer 4600 185
User Guide
Fiber End Face
Plastic End Cap Surfaces
Normal Trace
With Spectral
Window Applied
Fiber End Face
Plastic End Cap Surfaces
Normal Trace
With Spectral
Window Applied
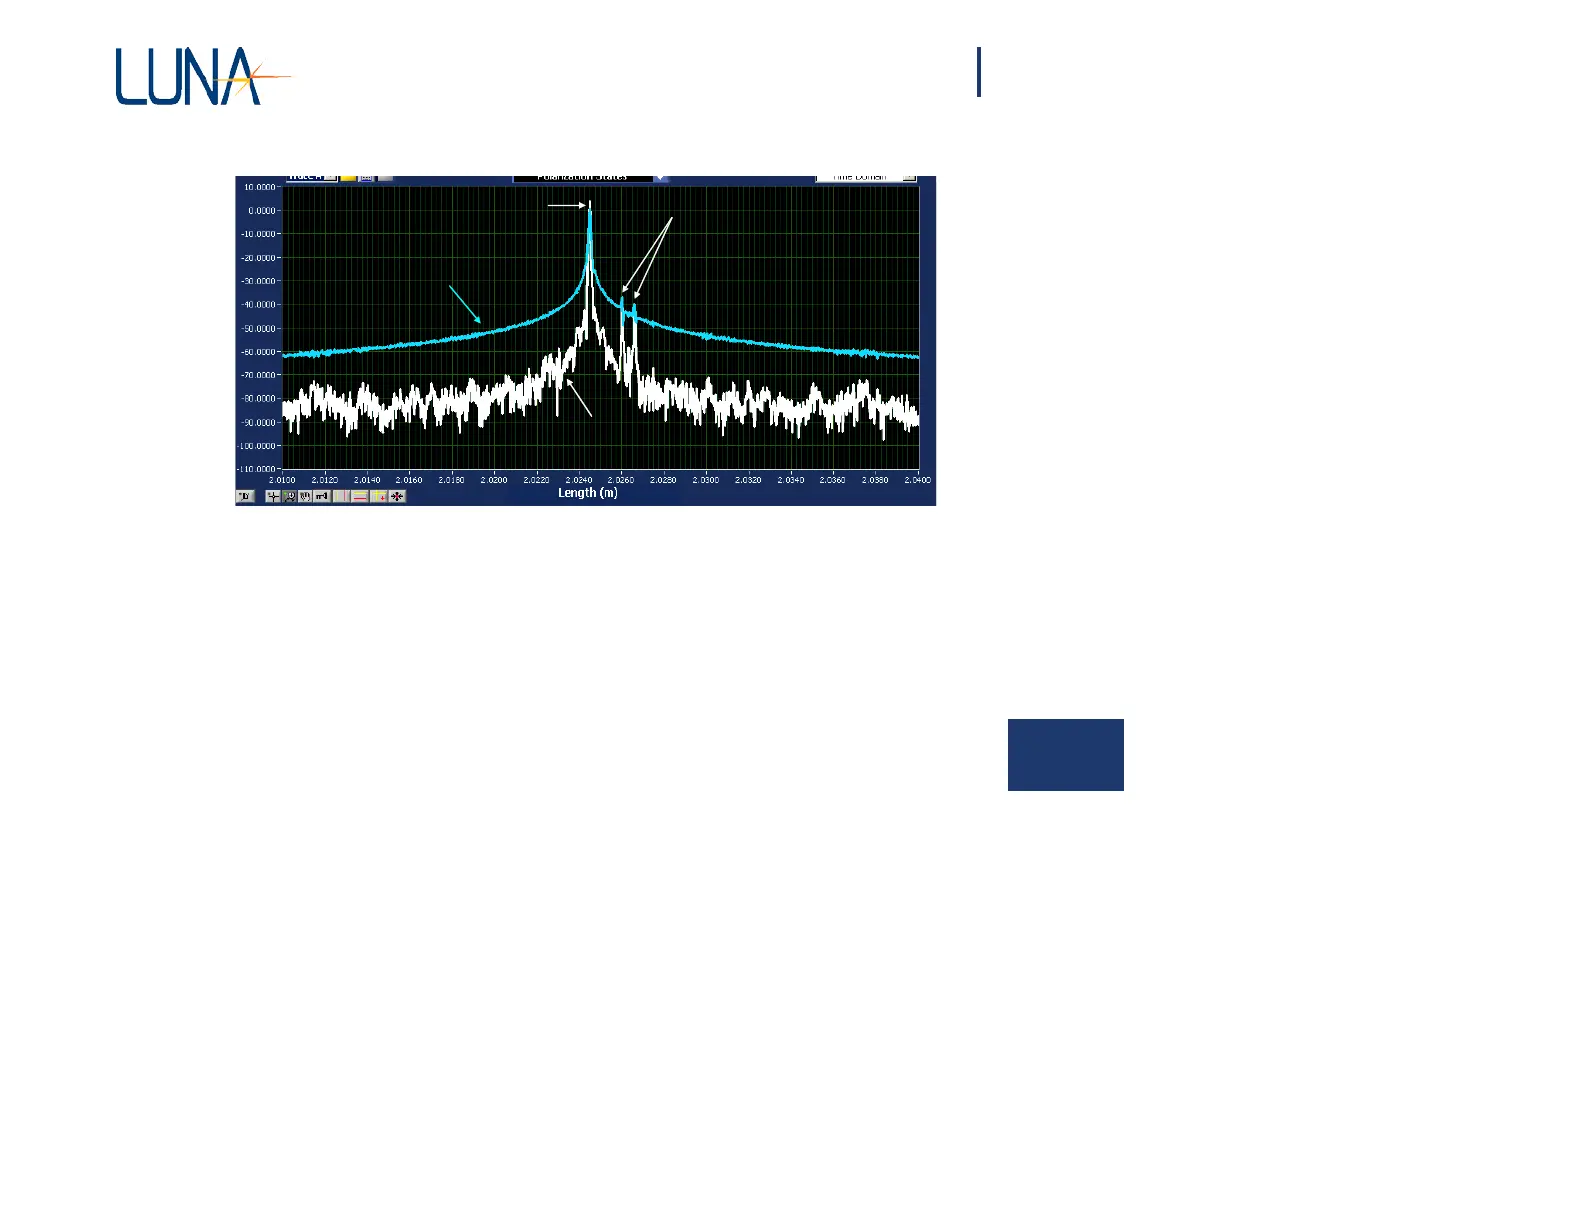
Figure 8-10. OBR traces of a FC/PC connector with a clear plastic cap over the
ferrule with (white) and without (blue) a Frequency Domain Window applied.
Each major x-axis division is 2 mm.
Another example which demonstrates the usefulness of the Frequency Domain
Window function is illustrated in Figure 8-11. In this example, a series of short patch
cables are connected to the front panel of the OBR. A pair of FC/APC connectors
at the front panel at L = 0 m is followed by a pair of ST connectors at L = 0.25 m,
followed by a lossy FC/APC connector pair at 0.50 m, and a final FC/APC connector
pair at L = 1.0 m. In the normal trace (blue), the side band tails from the ST connector
pair overwhelm the nearby fiber Rayleigh scatter, making an accurate measure of
the insertion loss between nearby connections impossible. When the same set of
patch cables are scanned with the Frequency Domain Window applied, a new trace
is produced (white) in which the side band tails of the ST co
nnection at 0.25 m are
suppressed and a large insertion loss at the connection at 0.5 m is now obvious.