82 Chapter 6
LightPath Analysis Software Guide
going from the input level to the return loss. Drops are depicted with a vertical line
going from a floor of -115 dB to the input level.
The color of each feature
indicates whether
it passed or failed,
compared
to the values
in the Reference Trace or Parameter Configuration File. Peaks and Fiber
segments are shown as green (pass) or red (fail). Drop segments are shown as blue
(pass) or purple (fail), to make them stand out visually from the peaks.
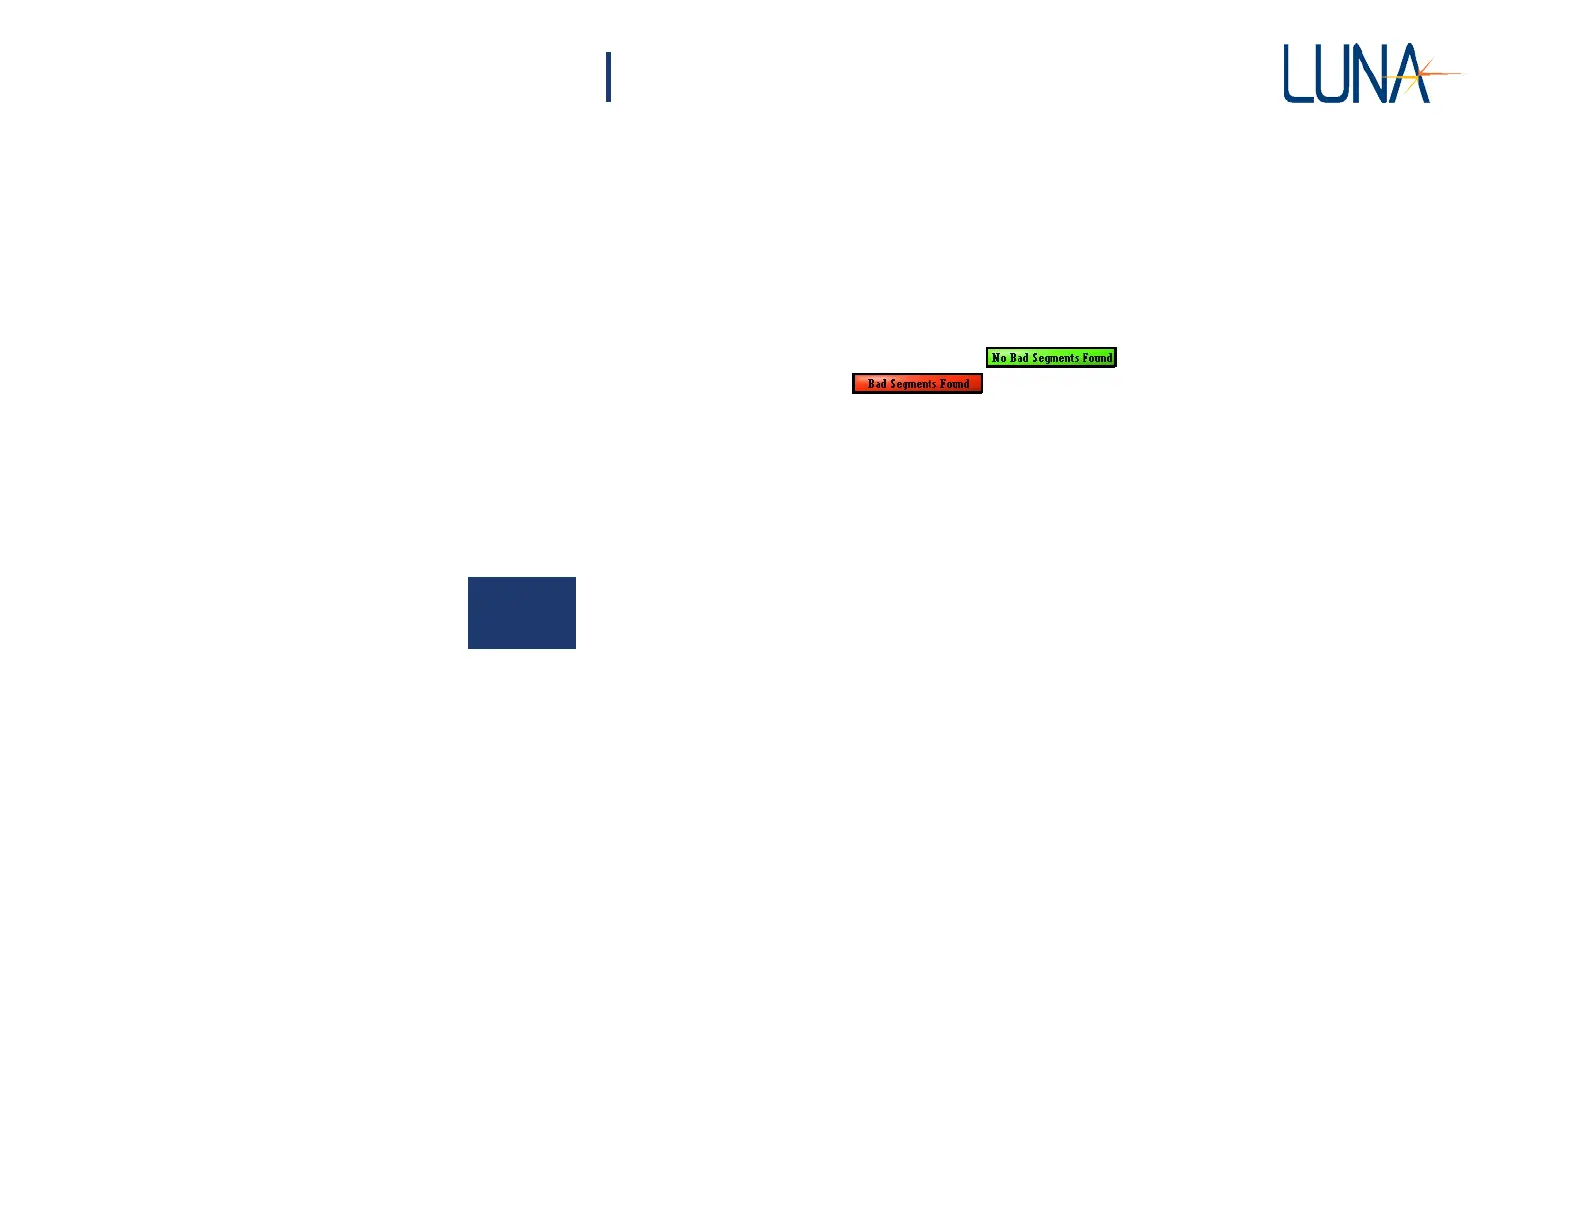
An indicator in the top right of the lower graph shows whether all segments have
passed their individual tolerances , or if some failing segments were
found in the trace
Changing Data Processing Parameters and Tolerances
Several parameters affect the feature detection algorithm—i.e. how the software
passes or fails a feature in the data. The user may adjust the parameters so that all
desired features for a particular device are detected, and random noise disregarded.
In this
comparison
of
device1.obr
data to the default
Parameter Configuration
File,
notice that the two peaks near the 2.0 m point are combined into a single feature in
the lower graph. The processing parameters in the Parameter Configuration File
can be adjusted so that these are detected as two distinct peaks.
Select Setup > Data Processing Parameters from the main menu to show the
Parameter
Specifications
window (Figure 6-4). This displays the
Parameters
used
to delineate trace segments and the Tolerances used to mark them as passing or
failing.