54 Chapter 4
Performing Measurements
Distributed Sensing Examples
4
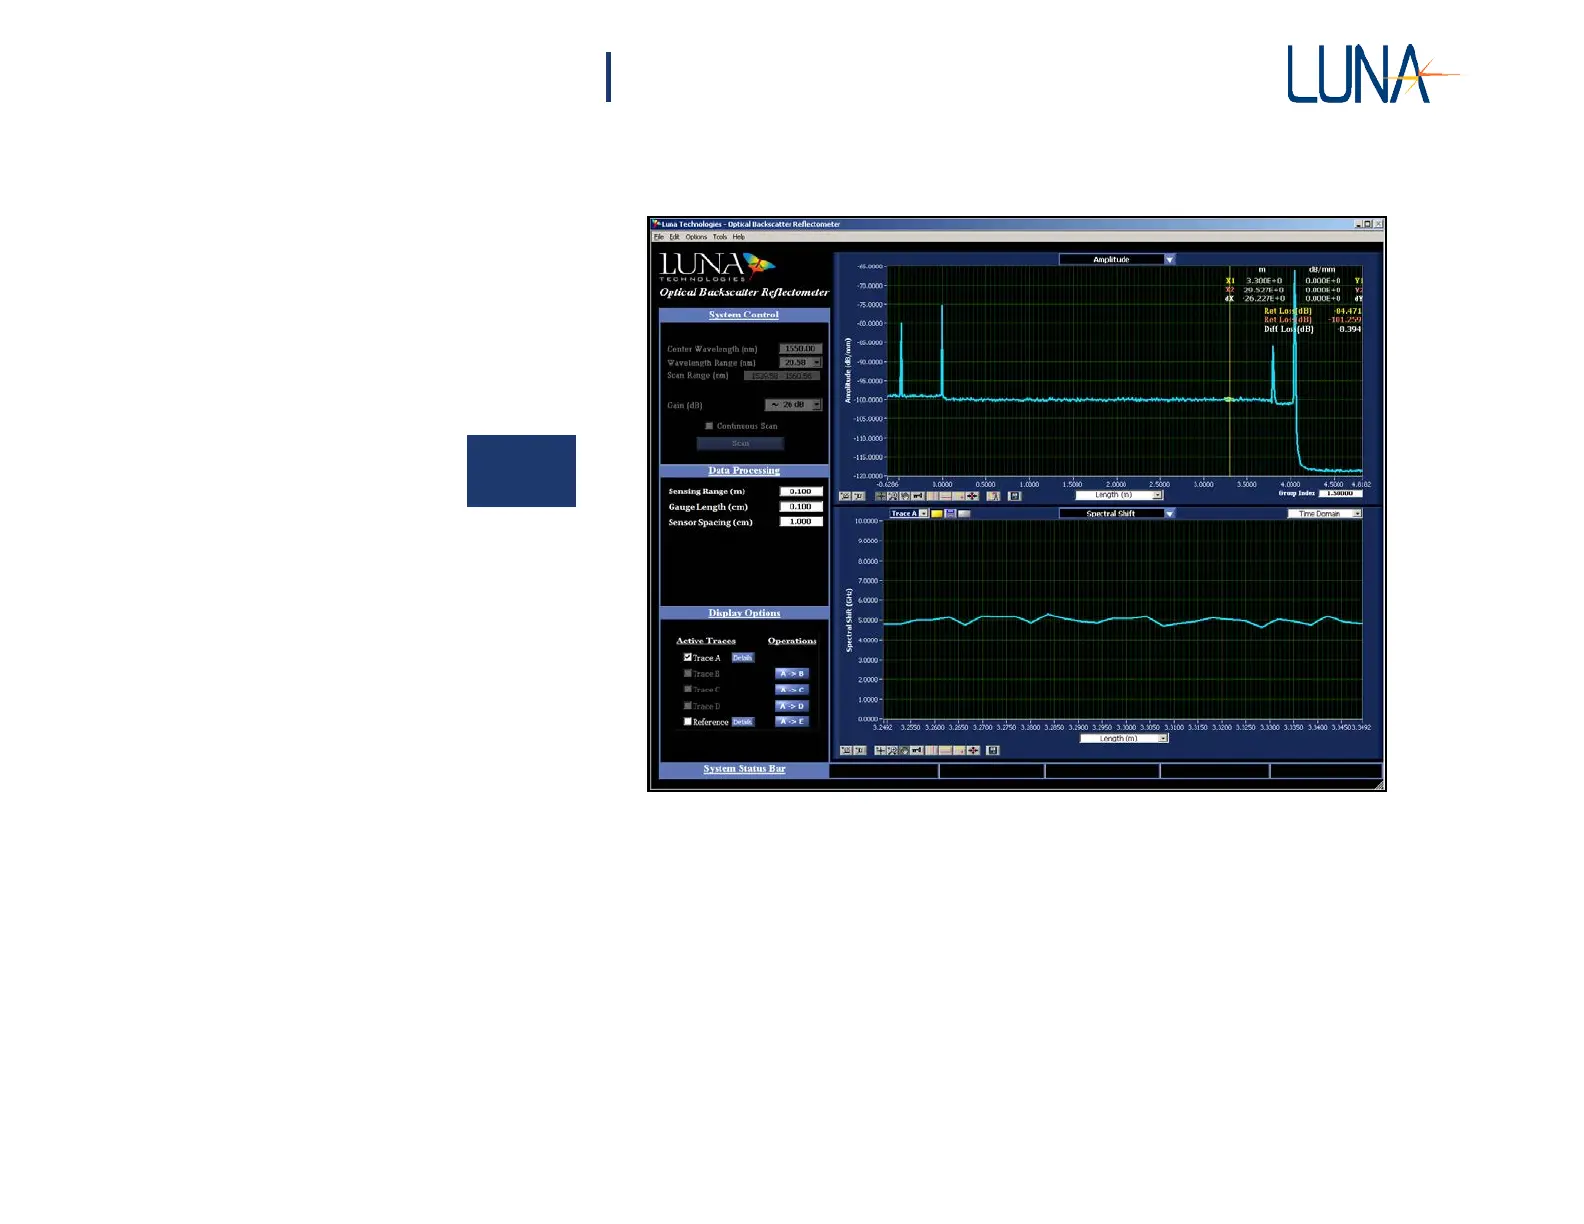
Figure 4-9. Control panel settings for a spectral shift measurement. Note that the
Shift Reference is loaded (as indicated by the blue Details button for Trace E)
but not displayed (the Active Traces check box is unchecked for Trace E).
The temporal or spectral shifts are calculated for the area defined by the upper graph
vertical cursor location and the Sensing Range setting in the Data Processing area.
In Figure 4-9 above, the Sensing Range is set to 0.1 m, with the vertical cursor at
3.3 m; thus the lower graph shows the data from 3.25 to 3.35 m. The data shows a
spectral shift of approximately 5 GHz, measured with a 1 cm Gauge Length. (For
further discussion, see “Gauge Length” on page 52.)
To quantify the local spectral shifts due to a change in temperature or strain, the
complex data sets are Fourier transformed back into the frequency domain. A vector