74 Chapter 5
Data Processing and Display
Spot Scan
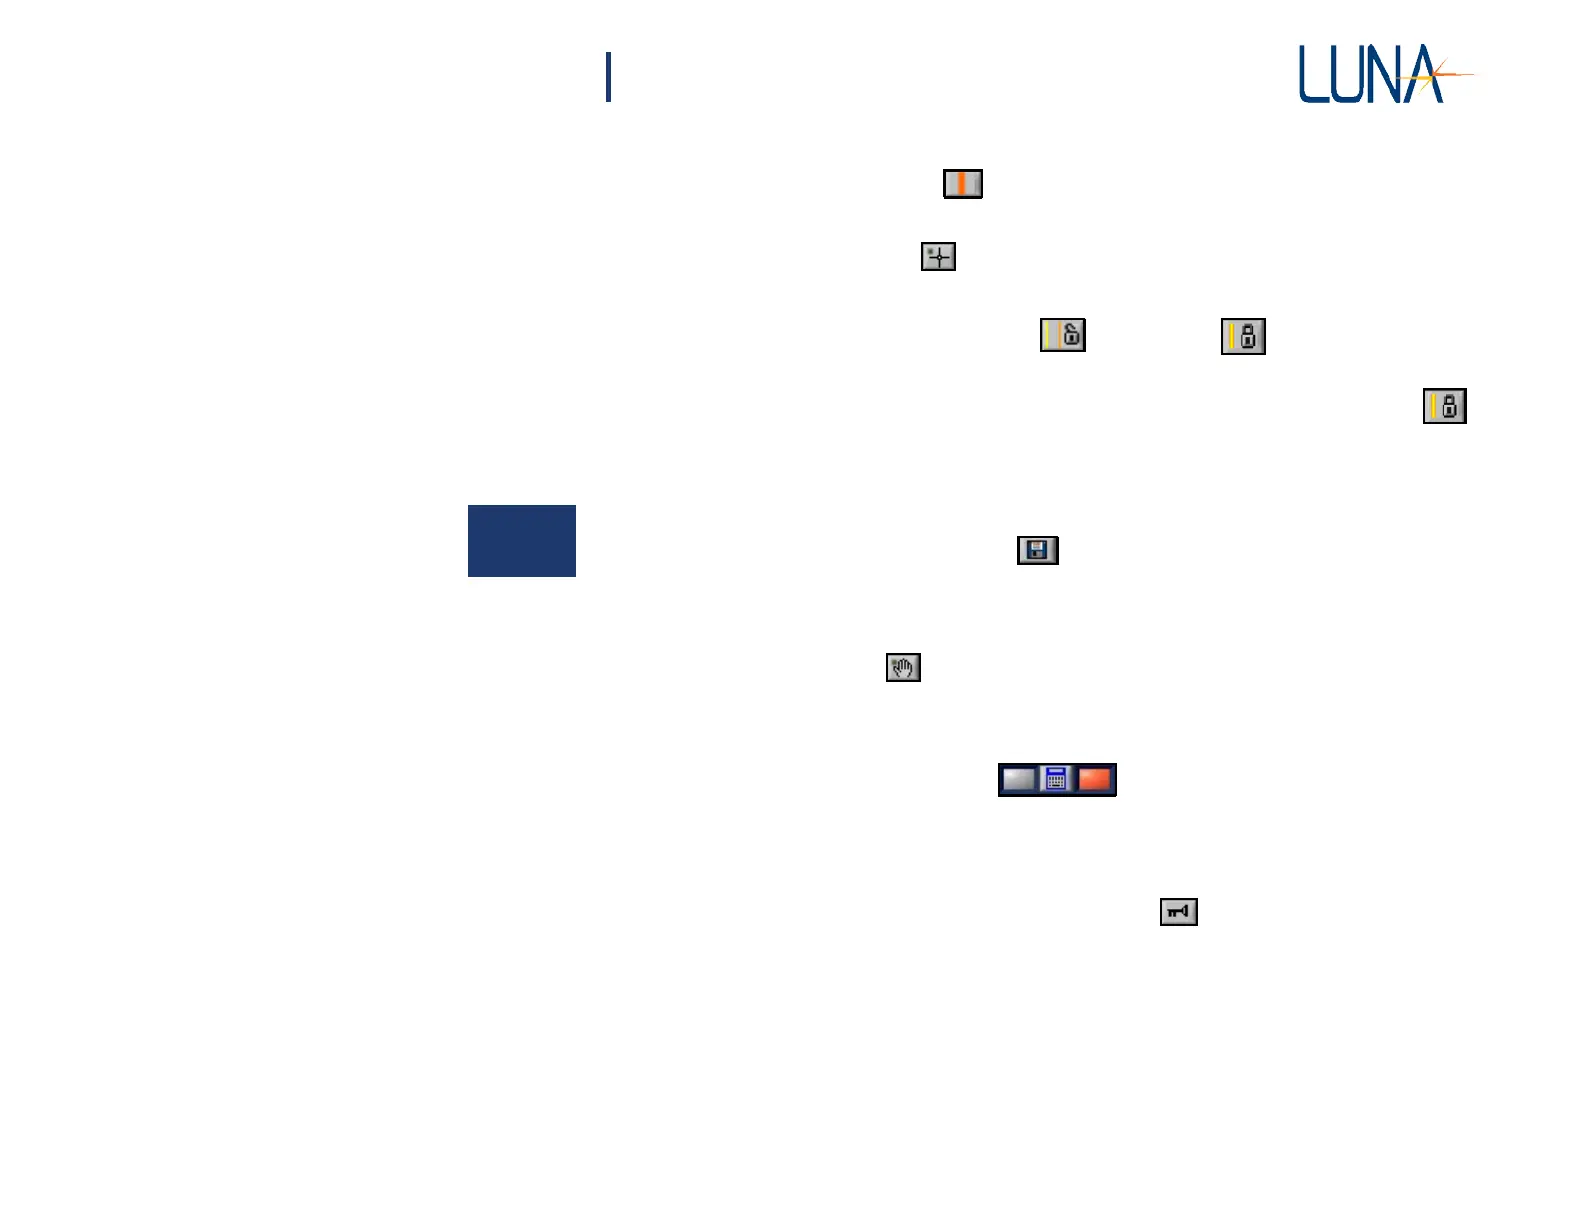
Cursor:
Clicking this button turns on the spot scan cursor.
Select the cross-hair tool to move the spot scan cursor to a region of the data
where you desire a spot scan. See “Spot Scan Mode” on page 44 for more details.
Spot Scan Cursor Unlocked or Locked Toggle Button:
Clicking the first button (showing the unlocked icon) locks the spot scan cursor to
the active vertical cursor. The button icon with then change to a closed lock:
Clicking this button again will unlock the spot scan cursor from the active cursor.
The icon changes to display the current state of the cursors.
See “To perform continuous spot-scan measurements” on page 46 for more details.
5
Save graph as image file:
Clicking this button in the upper (or lower) graph area prompts the user to save the
current upper (or lower) graph as a .jpg image file.
The pan tool:
This tool lets the user pan around the data in a graph window. To use this tool, first
select it from the button menu, then click on the graph and drag the cursor.
The recalculate buttons:
See “Updating Lower Graph” on page 67
Legend
A plot legend can be displayed by clicking the button in the graph window.
Changing graph style and color
The user may change the color or line style of an individual graph by first turning
on the legend. Next, click inside the legend to call up a menu which allows the user
to select line color, style, and width.