Optical Backscatter Reflectometer 4600 69
User Guide
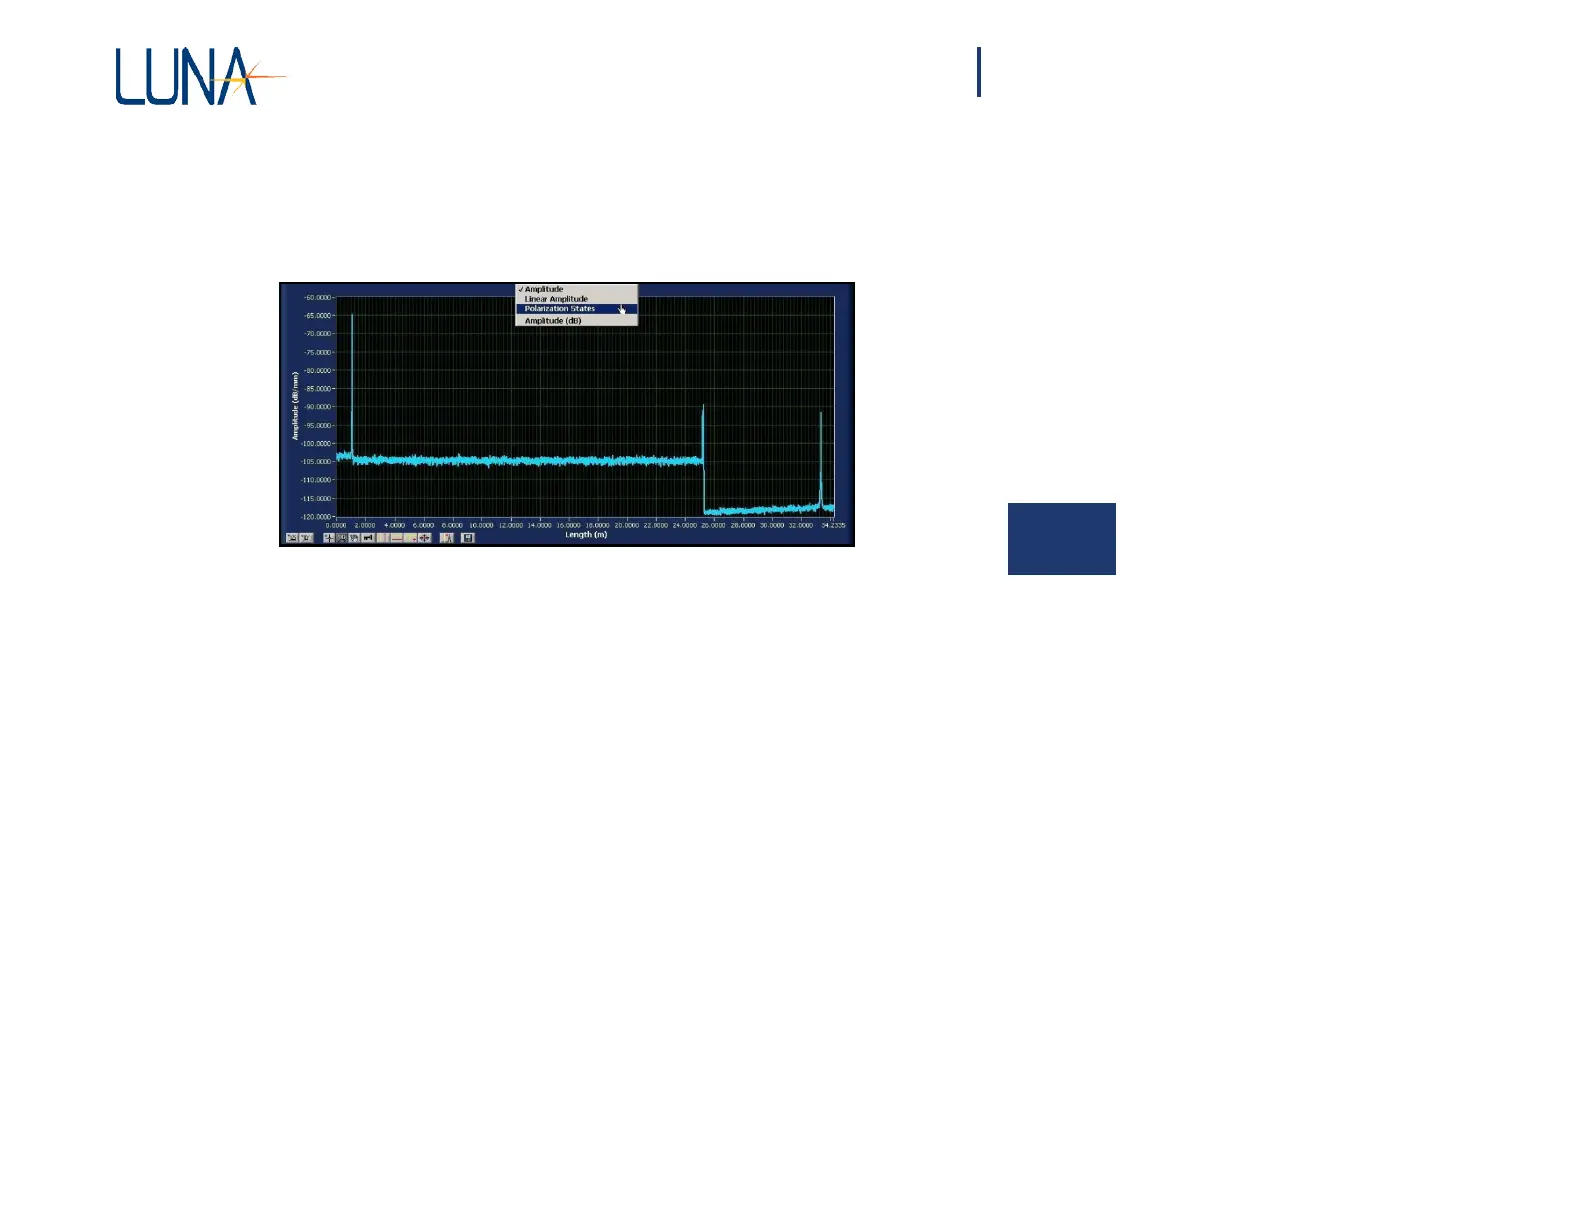
To change the content of a graph window
1 Click on the Title Bar of the graph. A drop-down list of the available
plot parameters appears.
5
Figure 5-5. Upper graph window showing the Title Bar pulled down
for parameter selection.
2 Click on the desired parameter from the list.
The content of the graph changes, as do the title and the axis labels (if necessary).
Scaling Plot Axes
The OBR control software provides several ways for adjusting the scaling of the
graph windows.
Autoscaling
Autoscaling refers to the automatic adjustment of plot axes so that all of the data
fits in the graph window.
By default, the graph windows will autoscale the Y-axis when new data is scanned
or loaded from memory. To toggle autoscaling on and off for either graph area, select
Options > Display Options > Autoscale Y Axes (Both Graphs) or Autoscale X
Axis (Upper or Lower Graph). A check mark next to these selections indicates
that autoscaling is turned on. Note that the lower graph X-axis scale is based on the
highlighted section of a vertical cursor in the upper graph.