Optical Backscatter Reflectometer 4600 23
User Guide
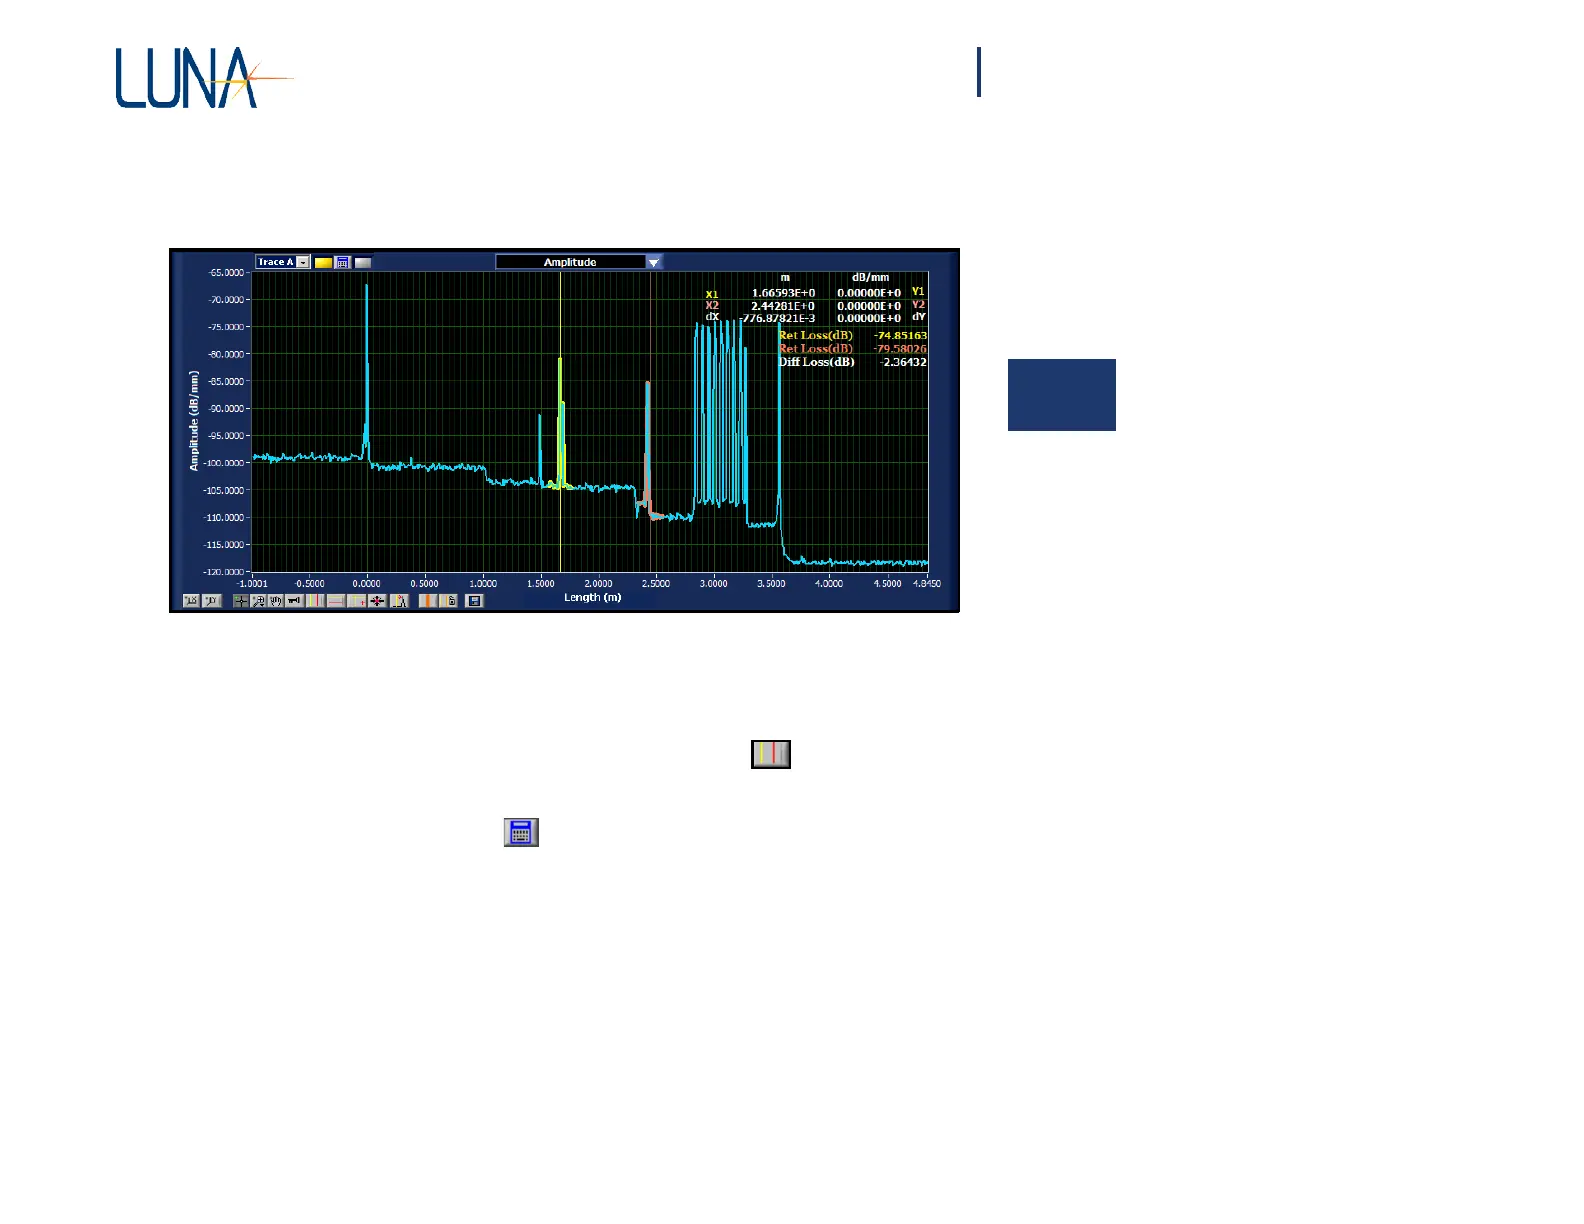
Graphs
Each Graph area contains controls for selecting the content of the graph and for
manipulating how the graph is displayed.
3
Figure 3-5. The upper graph area in the main OBR software window.
• The upper graph will display newly scanned or loaded data.
• Two conditions allow data to appear in the lower graph:
Standard Scan Mode: First, the vertical cursors must be turned on
in the upper graph. Second, either Options > Display Options > Auto-
Update Lower Graph must be turned on (checked), or the user must click
the recalculate button at the upper left of the upper graph. Controlling
the content of the lower graph will be covered more fully under “Updating
Lower Graph” on page 67.
Spot Scan Mode: Data will also appear in the lower graph during continuous
spot scans if the upper vertical cursors are on (see “To perform continuous
spot-scan measurements” on page 46).
• The Title Bar at the center top of each graph contains a pull-down
menu allowing the user to select which parameter is graphed. These
parameters are defined under “Standard Parameter Calculations” on
page 179.