60 Chapter 5
Data Processing and Display
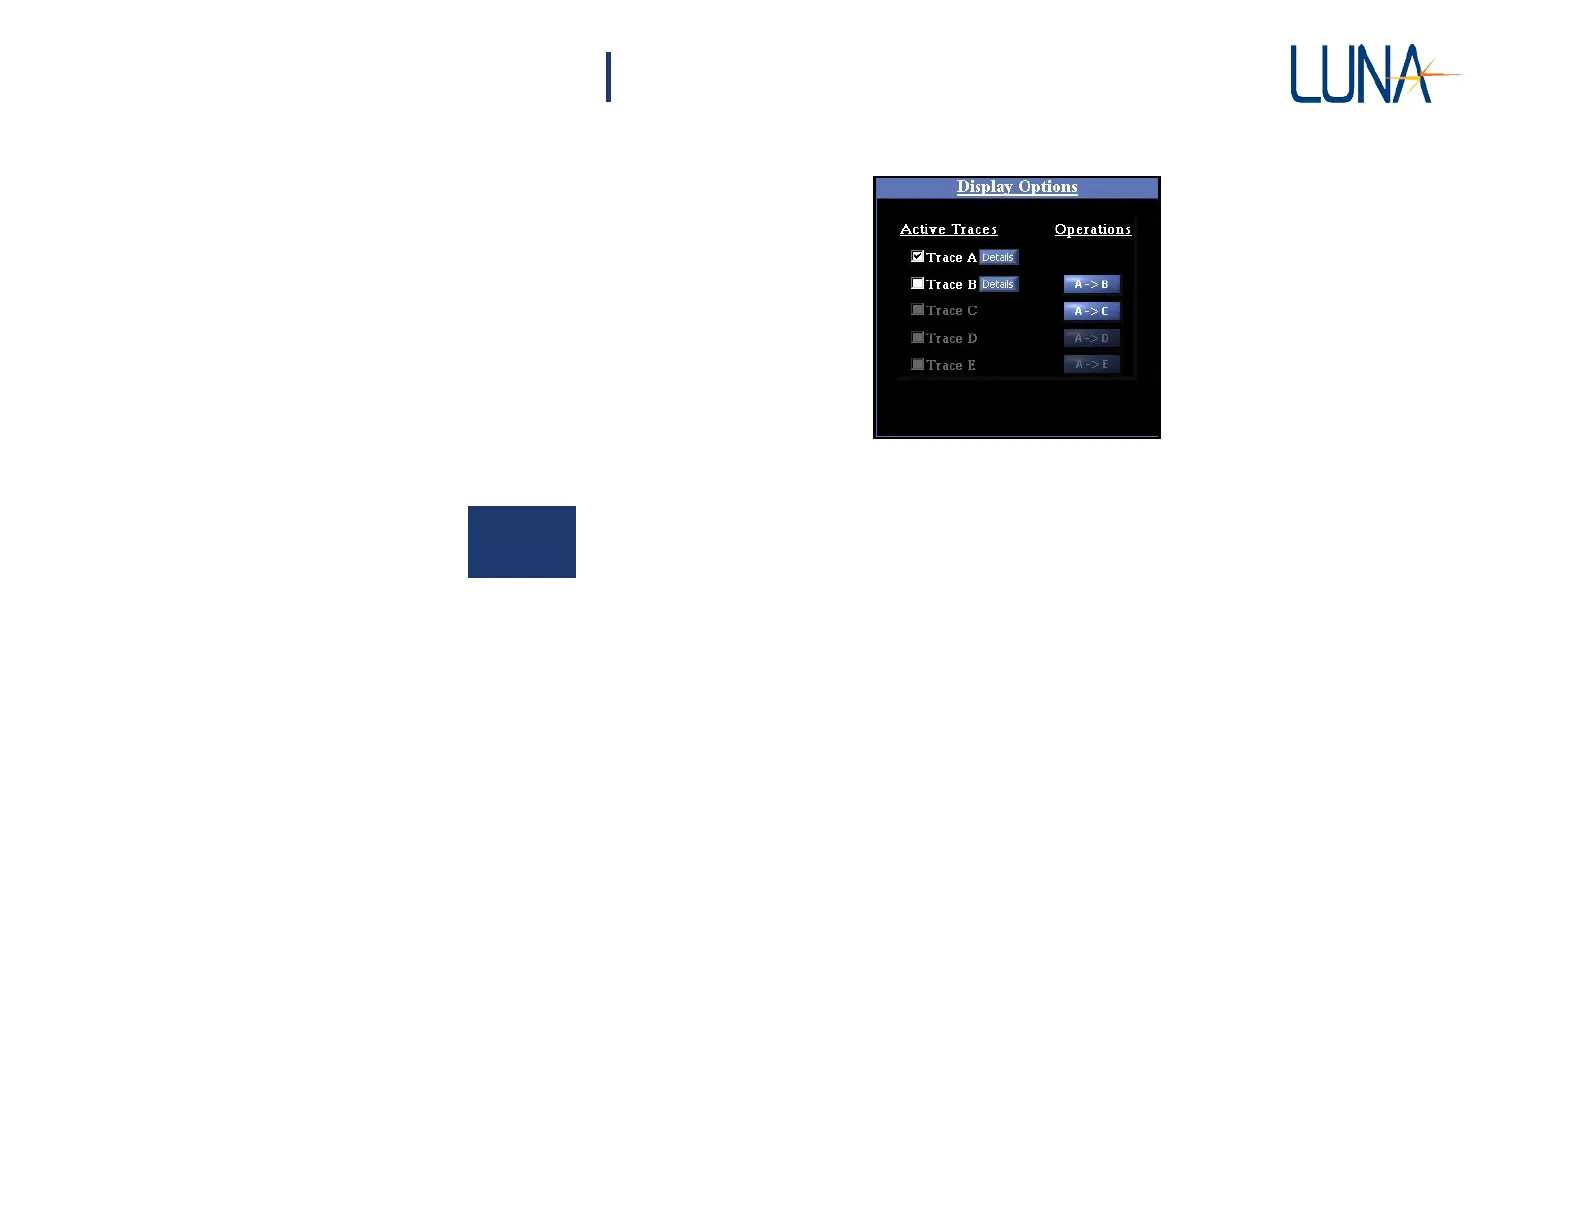
Figure 5-1. The Display Options area in the main OBR software window. In the
example, data has been loaded into Traces A and B, but only Trace A is being
displayed, as indicated by the check boxes.
5
Displaying Stored Data
The control software can display any combination of Traces A through E
simultaneously in the graph windows if the OBR is on and connected. By default
the data in Trace A is plotted as a blue curve, Trace B is red, Trace C green, Trace
D yellow, and Trace E pink. In the example in Figure 5-1 above:
1 Trace A contains data, as indicated by the white name and checkbox
and the blue Details buttons. Trace A is being graphed, as indicated by
the filled-in checkbox. To clear this graph, click to clear the checkbox
by Trace A.
2 Trace B also contains data but is not being graphed. Clicking in the
second checkbox adds Trace B to the graph window.
3 Traces C has no data in it, as indicated by the grayed name and lack
of a Details button. To overlay another plot, the user could move data
into this trace using the A->C Operations button or by loading data
from the hard drive. (See “Saving and Loading Data Files” on page 62.)
4 If the headings for Traces C through E are not visible at all in the Data
Management area, this indicates that the software is operating in
“Desktop Analysis” mode. To make these traces available, the user
would have to connect and turn on the OBR.