24 Chapter 3
Software Guide
3
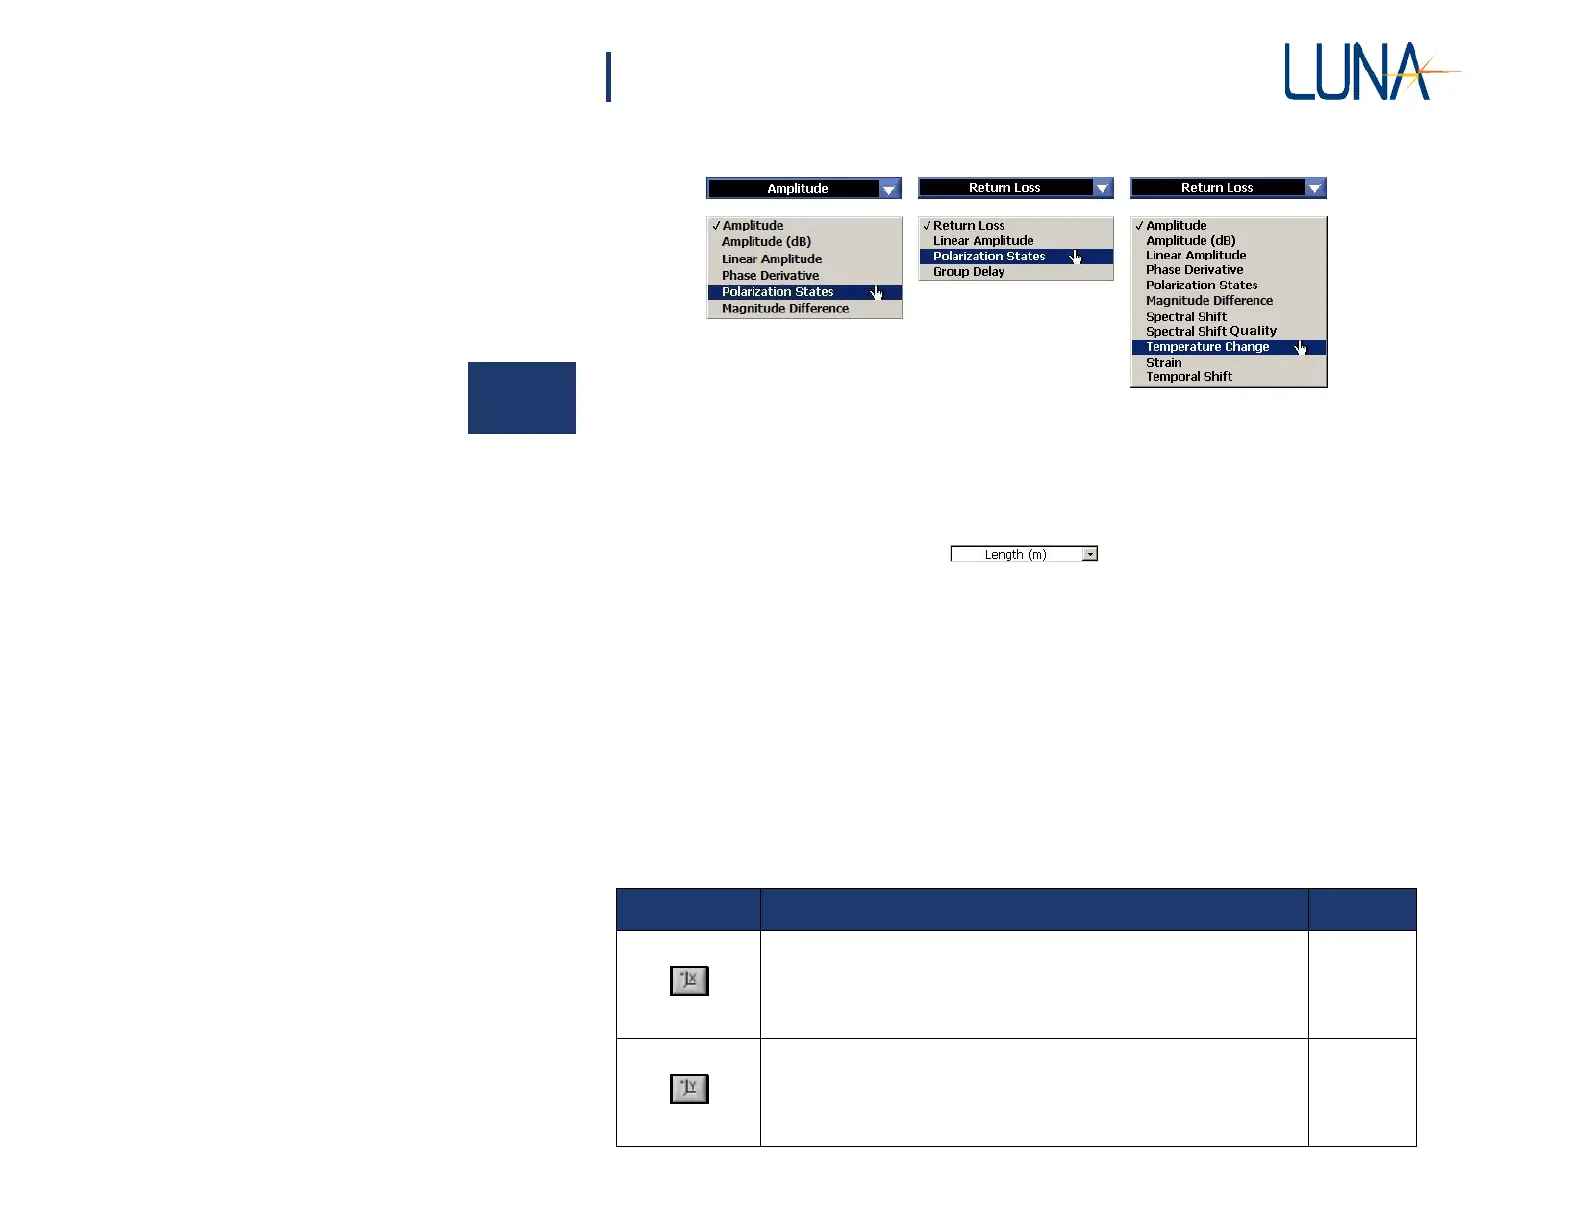
Figure 3-6. The parameters menu on the left is available for the upper graph. The
menu on the right is the Time Domain menu for the lower graph area. The last
five parameters will be gray (unavailable) in some models. By selecting Fre-
quency Domain in the top right corner of the lower graph area, the menu
shown in the center becomes available.
• The pull-down menu at the bottom of a time
domain graph allows the user to select the value and units of the X-
axis: Time (ns), Length (m), Length (ft), or Length (in). In the
lower frequency domain graphs, the available X-axis units are
Wavelength (nm), Frequency (GHz), and Frequency (THz).
Note that the Y-axis units are determined by the parameter dis-
played.
• Buttons to the lower left of each graph let the user adjust plot axes,
cursors, and zoom, and show or hide a legend. Table 3-1 describes
the function of each button and gives a page number for further
explanation.
Table 3-1: Graph area buttons and their function.
Button
Description
Page
Sets the scale of the X-axis to display the full range of the data set.
69
Sets the scale of the Y-axis to display the full range of the data set.
69