186 Chapter 8
Measurement Theory
ST:ST
Normal Trace
FC/APC:
FC/APC:
FC/APC:
FC/APC
FC/APC
FC/APC
With Spectral Window Applied
ST:ST
Normal Trace
FC/APC:
FC/APC
FC/APC:
FC/APC
FC/APC:
FC/APC
With Spectral Window Applied
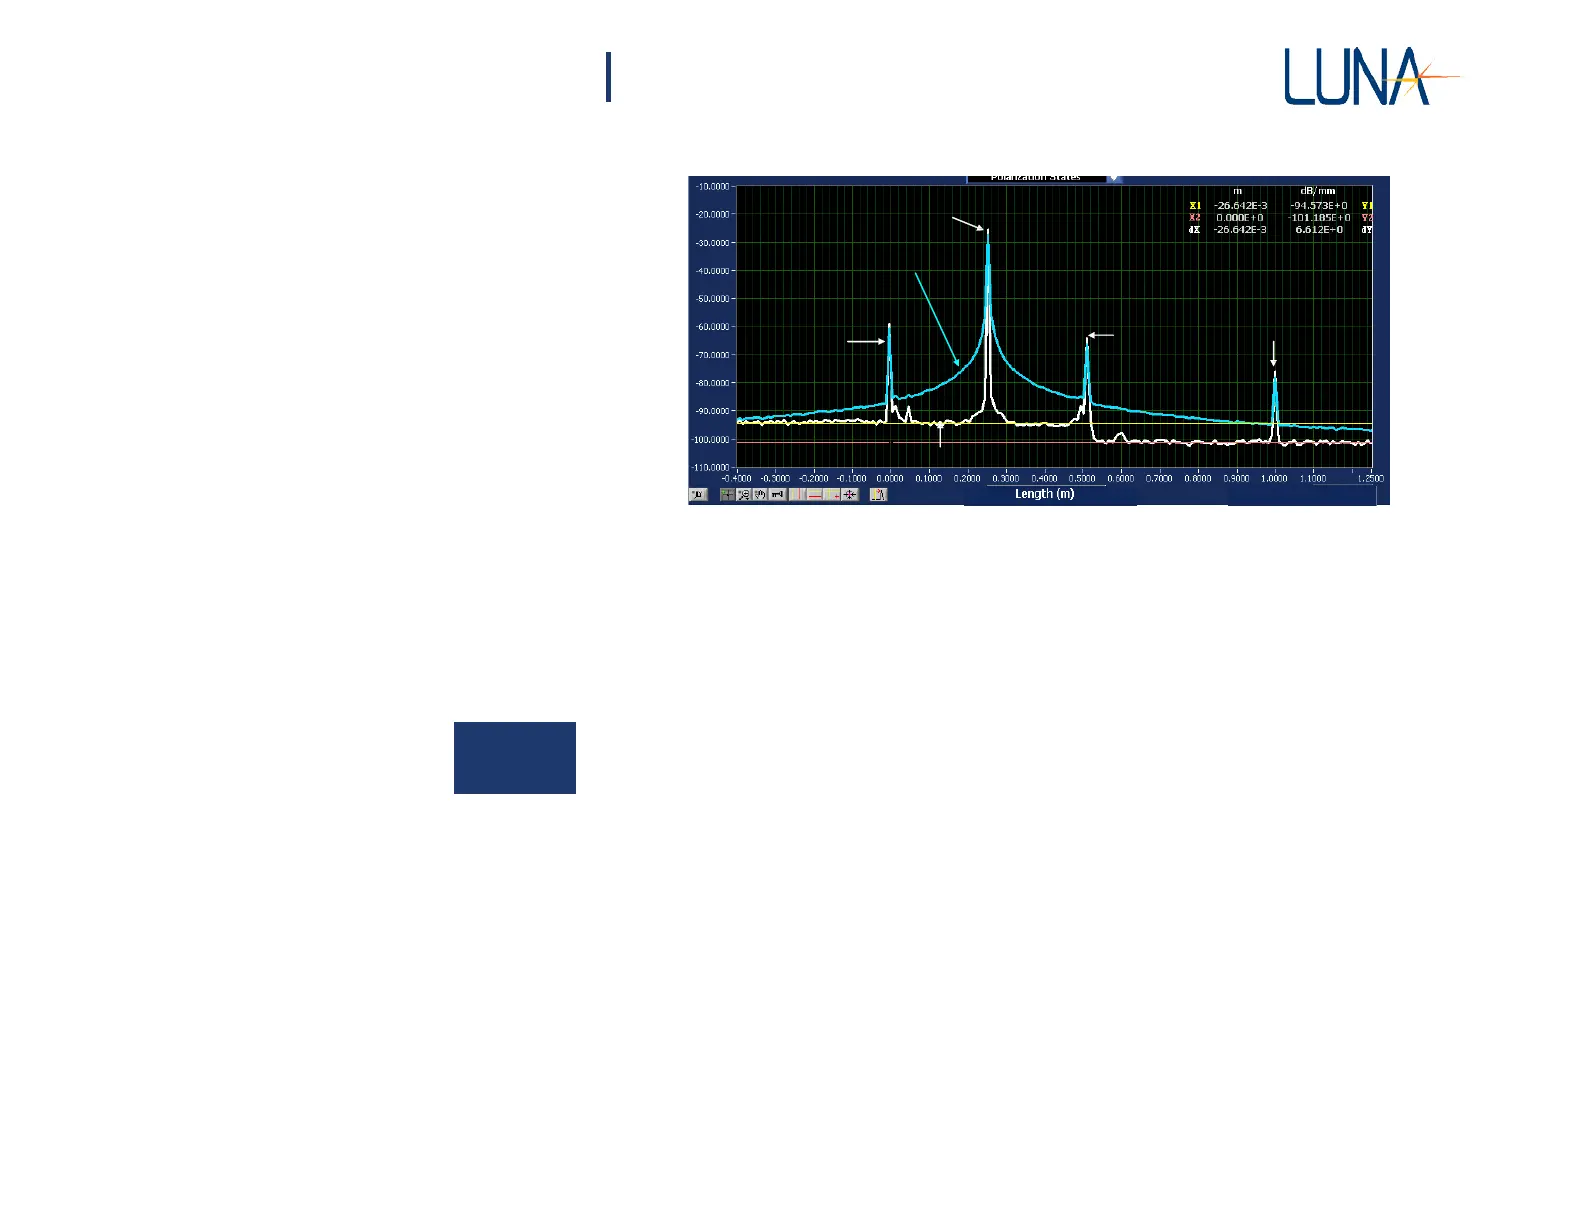
Figure 8-11. OBR traces of a series of short patch cables with (white) and without
(blue) a Frequency Domain Window function applied. Each major x-axis divi-
sion is 10 cm.
How Frequency Domain Window Effects Measurements
When a frequency domain measurement for a cursor-defined section of the upper
graph trace is displayed in the lower graph, the effects of the Frequency Domain
Window are removed by multiplying through by the inverse of the window function.
8
Return Loss
Return Loss (RL) values measured with the upper graph cursors, however, may be
altered by the Frequency Domain Window if the reflection event being measured
has significant RL variation in the optical frequency domain. Connectors and splices
tend to have spectrally flat RL, but fiber Bragg gratings and thin film filters do not.
For this reason, the Frequency Domain Window should be left off when measuring
the RL of gratings and filters. If you are not sure if the RL spectrum of your device
under test is flat, you can simply check by highlighting the device in the upper graph
with a vertical cursor and selecting the frequency domain setting near the upper right
corner of the lower graph.
Insertion
Loss
Insertion Loss (IL) measurements are made by integrating over the Rayleigh scatter
in separate parts of the network under test. Since fiber Rayleigh scatter is spectrally