Optical Backscatter Reflectometer 4600 89
User Guide
at the lower right, along with the tolerated minima and maxima. Note that the upper
of the three regions is blank for fiber sections, which have a Return Loss of zero.
The Min and Max values to the sides of the Targets represent the range of values
that will be considered passing for this particular feature. Any Min or Max values
that have been exceeded will appear in red.
In our example, all of the Min and Max values are currently based on the General
Tolerances used when last evaluating the trace. Press the View Summary button
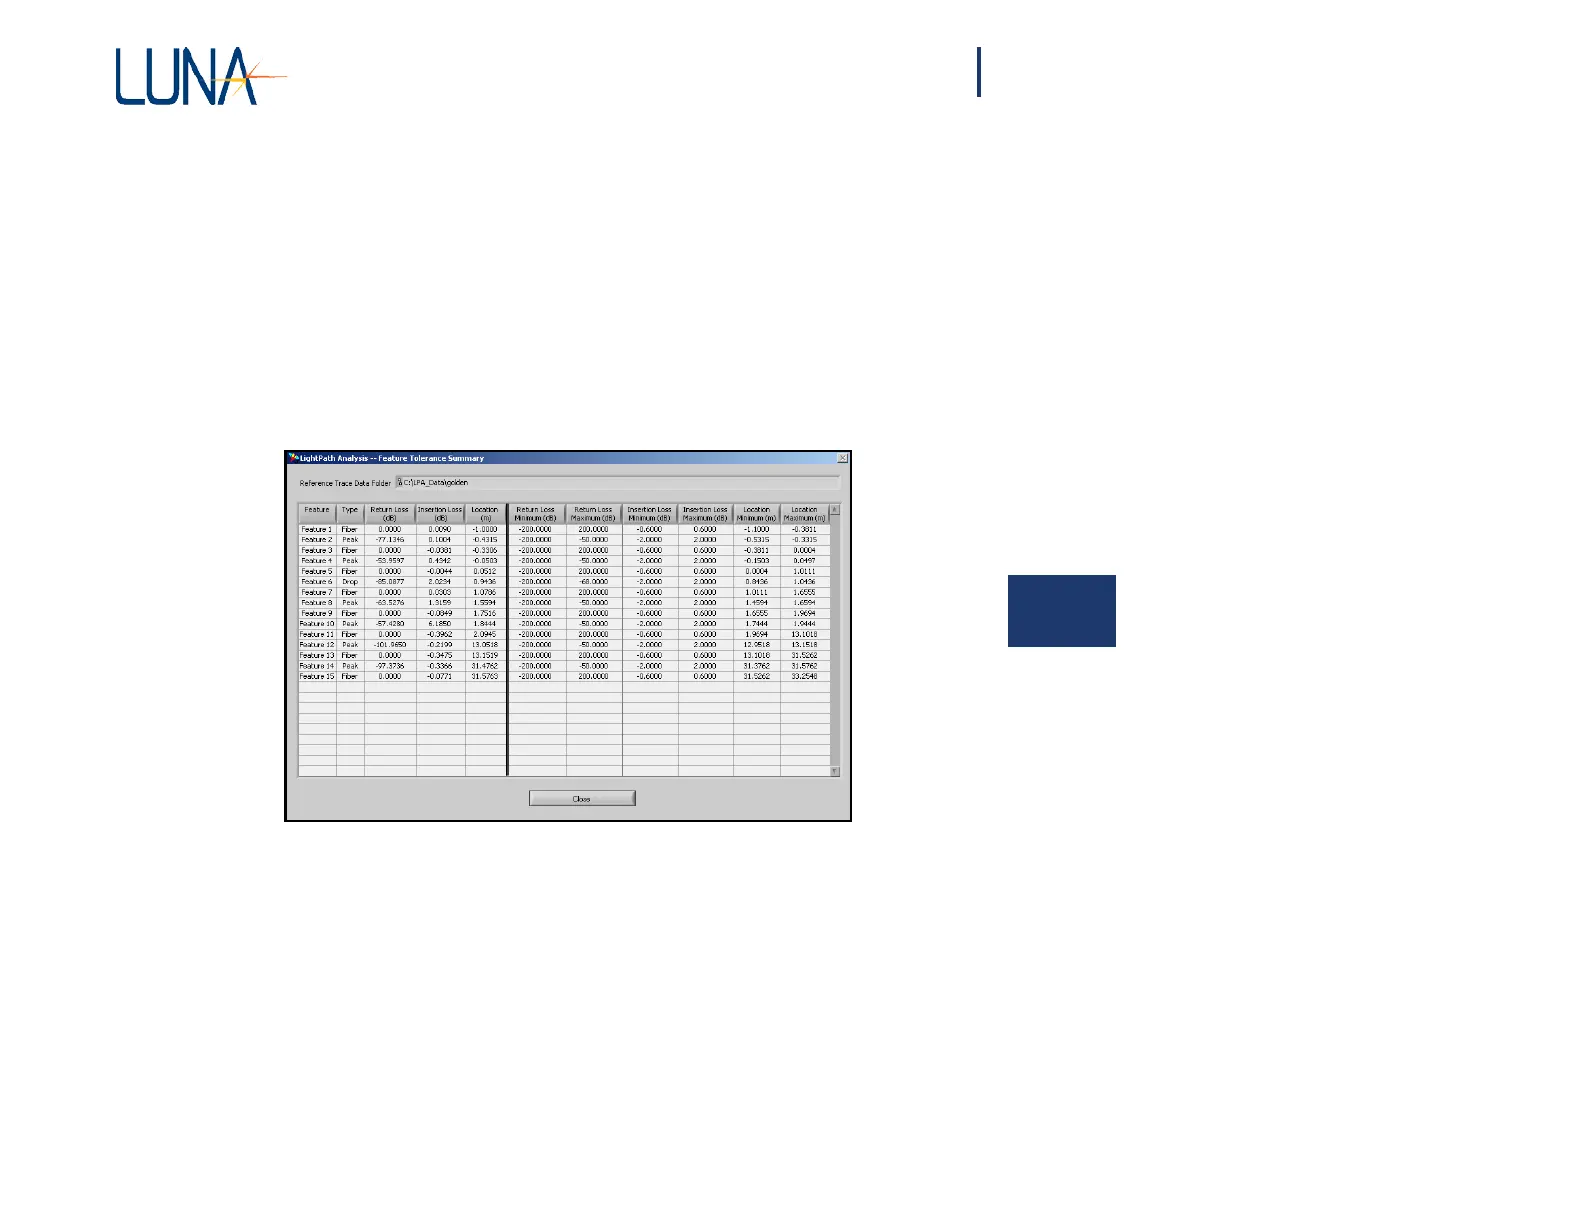
to view all of the feature details in one window, the Feature Tolerance Summary
(Figure 6-9).
6
Figure 6-9. The user may view this Tolerance Summary by clicking
the View Summary button in the Tolerance Specifications window (Figure 6-8).
Notice that the Return Loss Maximum for each peak is set to -50, the value you
set as the Peak Tolerance for the Parameter Configuration File, using in the
Parameter Specifications window shown in Figure 6-4 on page 83. However, we
left the Drop Tolerance at -68 in the Parameter Specifications window, as
confirmed in the Feature Tolerance Summary above.
Click the Close button to exit the Feature Tolerance Summary window.