137
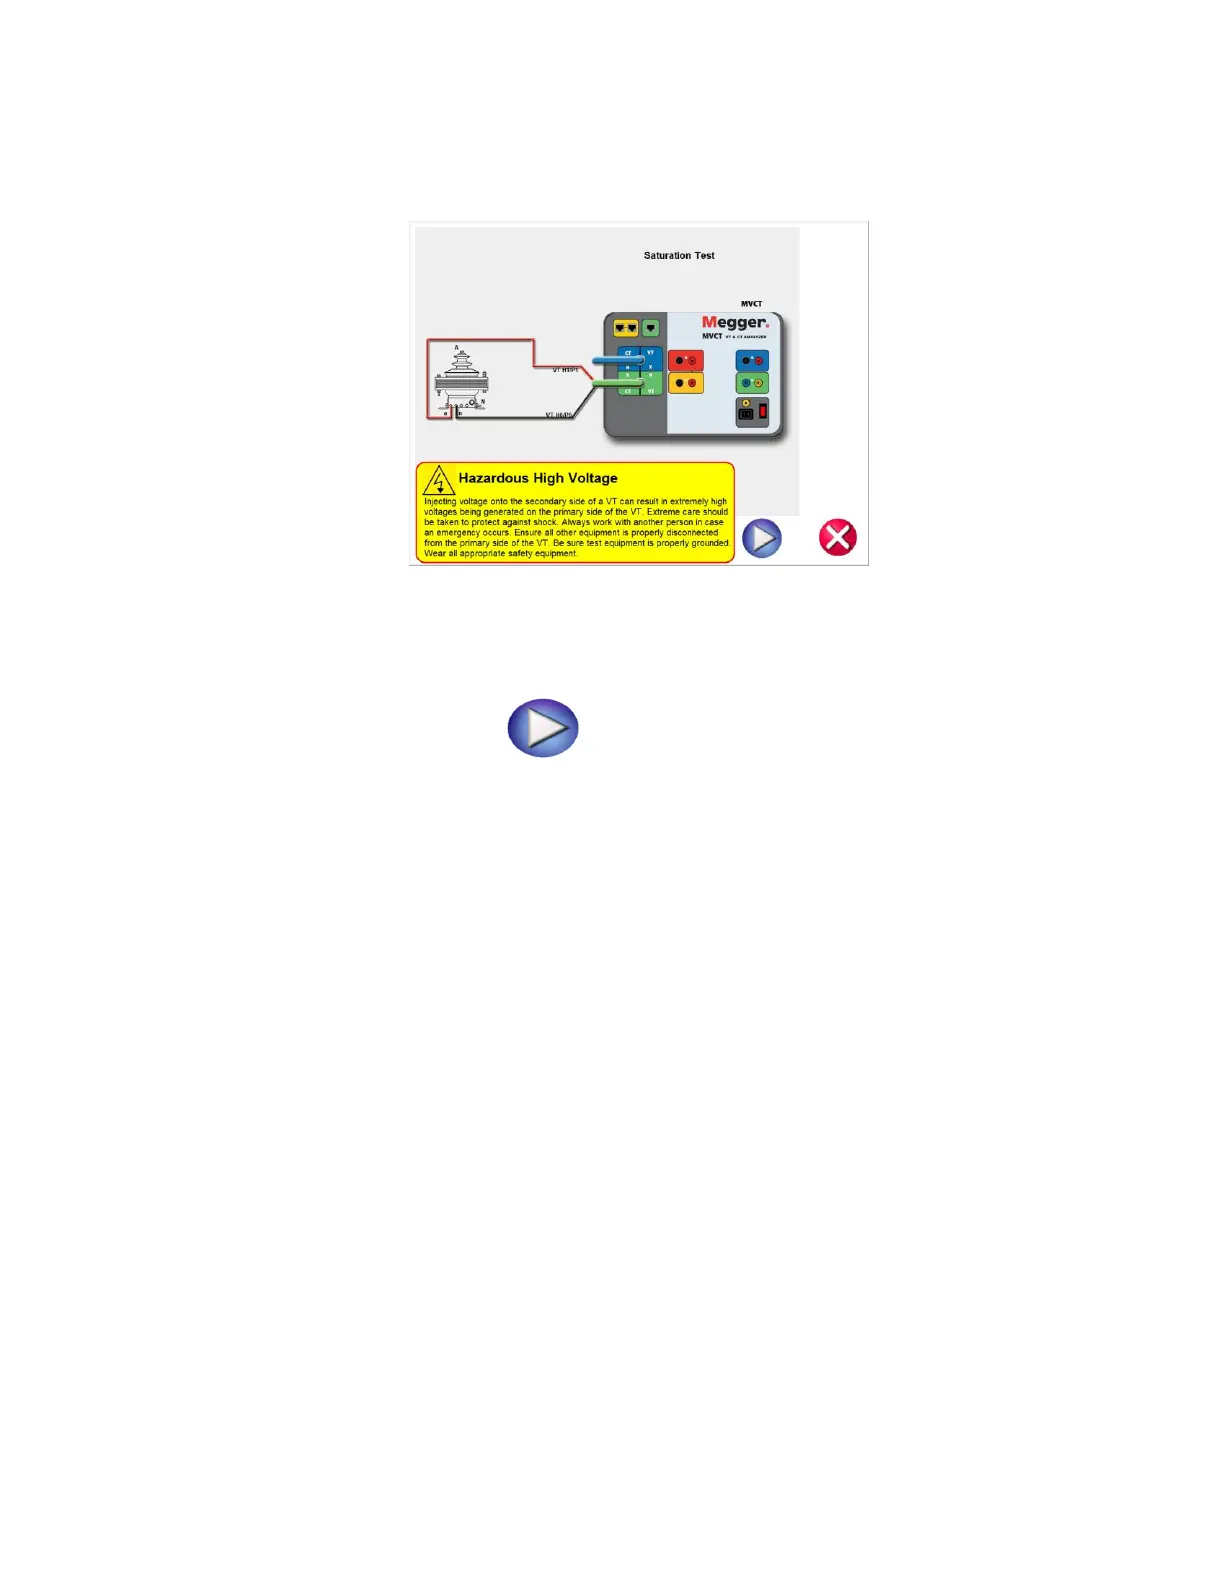
7. Select the blue play button and a connection diagram will appear showing how to correctly
connect the MVCT to the VT
Figure 109 VT Saturation Connection Diagram
8. Check all connections to ensure correctness
9. Hit Blue Play button to begin test.
10. The saturation will begin and the test voltage and current will be displayed
X Current (A): The MVCT the real time current readings for the secondary winding while the test
is in progress.
X Voltage (V): The MVCT displays the real time voltage readings of the secondary winding while
the test is in progress.
Saturation Curve: The excitation curve is Log-Log curve with secondary current on X coordinate
and secondary voltage on Y coordinate. The Saturation curve will be graphed in the chart in the
right hand corner of the screen in real time as data is accumulated.
11. At any point of time Test can be terminated by hitting the ABORT button at the top
of the screen.