44
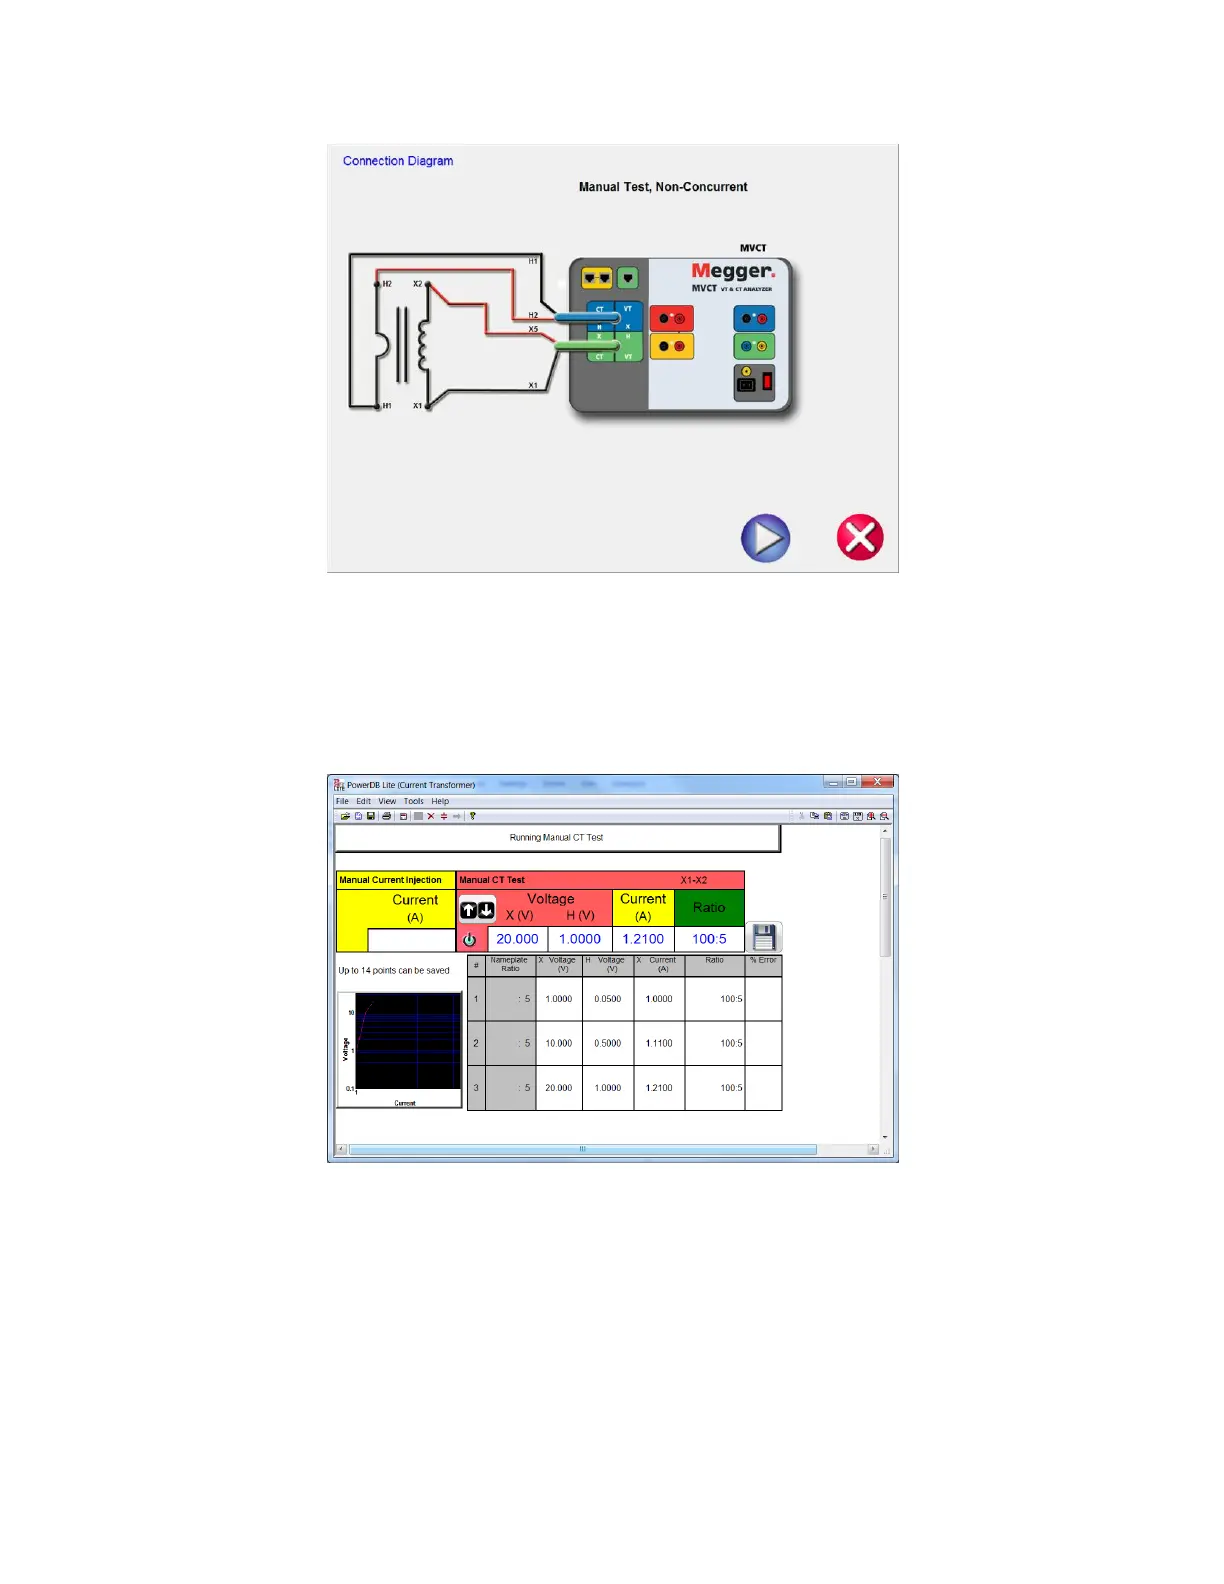
After the MVCT has begun to inject voltage, the voltage and current readings will be displayed along
with the calculated ratio. The user must ramp the voltage using either the round control knob on the
STVI or the up/down arrow keys on a laptop. Once the user has reached a desired voltage, a point may
be saved by selecting the image of a floppy disk.
Figure 19 Manual Test Example
Once the user has generated at least two data points, the MVCT will begin to graph the saturation curve.
The user can then continue to ramp the voltage while taking data points until the CT reaches saturation.
The user may store up to 14 data points.