59
Then the “ Ratio & Phase Error “ button will be visible within the report. This button will give the user
additional control over what is contained within the report. If the user included any of the following in
the report: Ratio Error Table, Ratio Error Graph, Phase Displacement Table, Phase Displacement Graph
and the CT under test has more than 1 ratio, then the user can specify to include additional taps in the
report
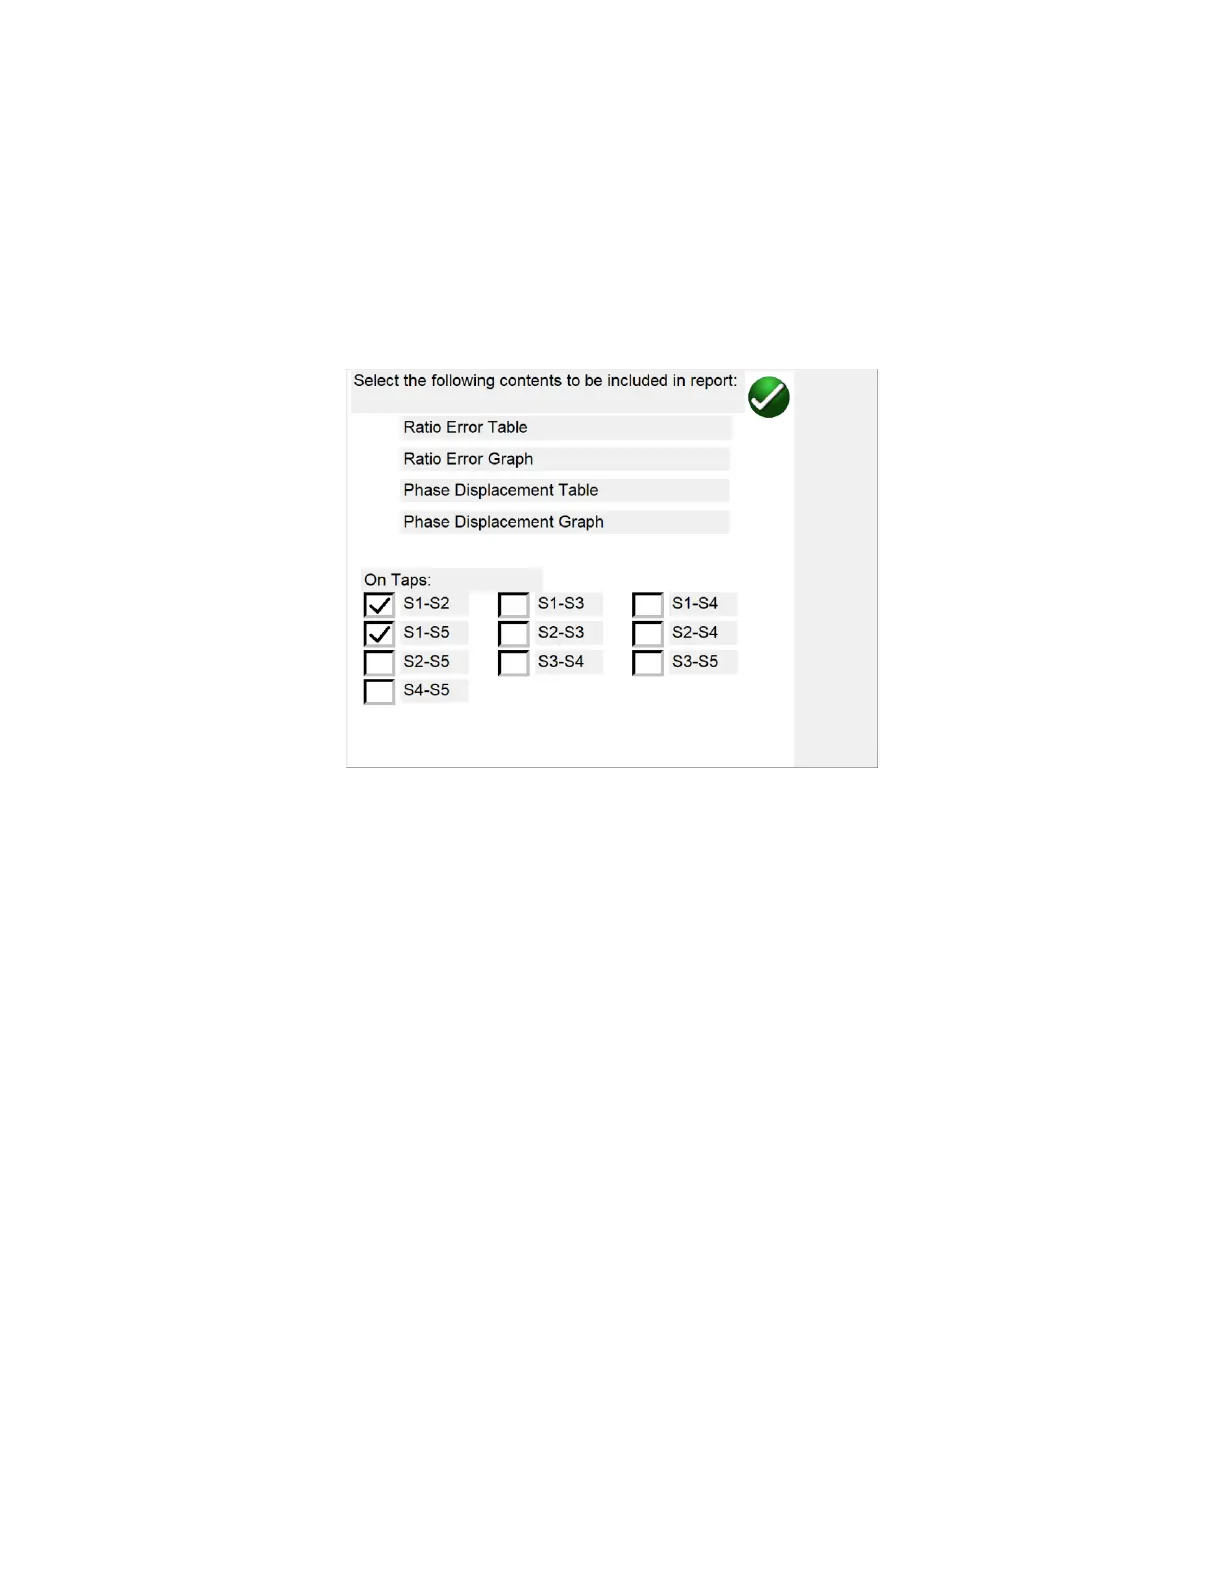
Figure 31 Report Tap Configuration Dialog
As mentioned previously, in device settings the user can configure the report to contain the ratio and
phase error tables and graphs, ANSI accuracy parallelograms, as well as a CT Assessment. But within the
report itself the user can configure any combination of taps or all the taps. Within the Tap Configuration
dialog, place a check mark in the box beside the desired data and the desired tap and data for that tap
will be included in the report. Please note that the nameplate data can be entered at any time either
before the test or after the test has been completed and saved and the “ Ratio & Phase Error “ button
will become available within the report. Also please note that by default, only the external tap is initially
included.
5.4.1.17 Excitation Curve Data
Data points for the excitation curve graphs are saved within each test file. Up to 30 data points for each
excitation curve can be displayed within the report by selecting the “Display Saturation Test Data” check
box within the report.