89
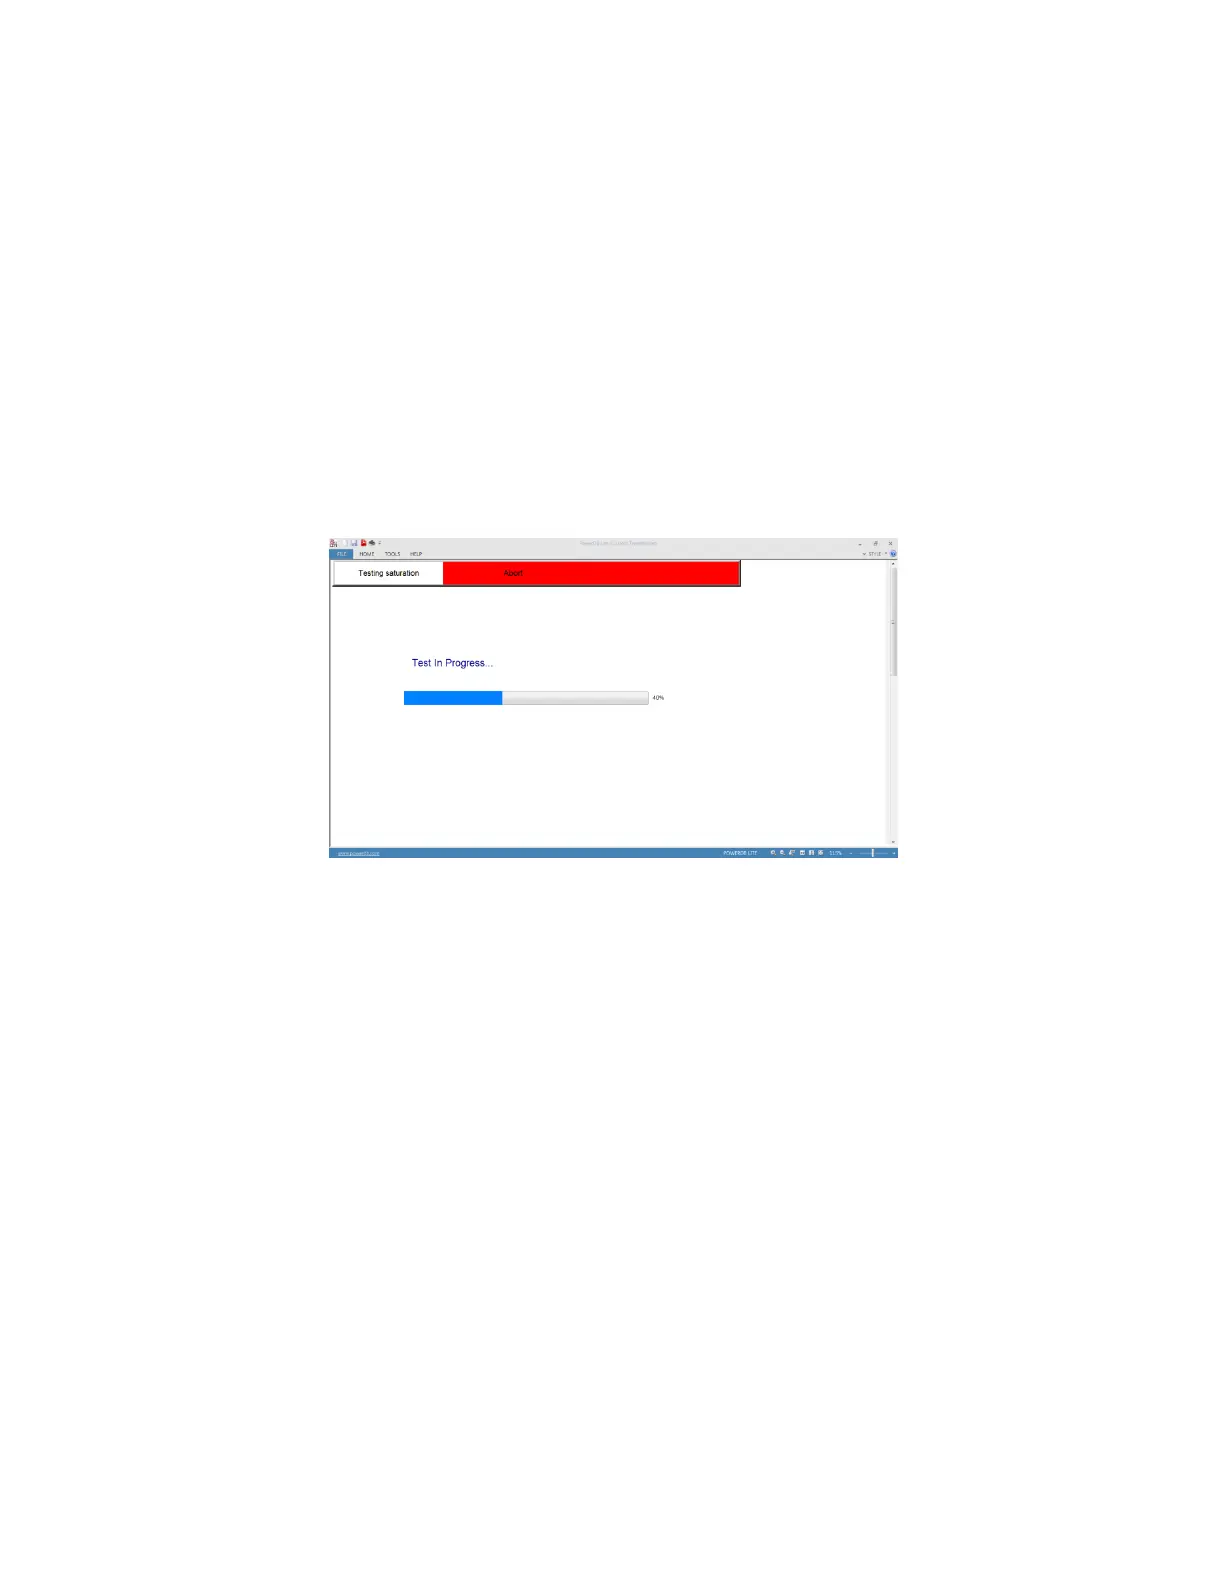
15. The saturation test will begin.
X Voltage (V): The MVCT displays the real time voltage readings of the secondary X winding
while the test is in progress.
X Current (A): The MVCT the real time current readings for the secondary X winding while the
test is in progress.
Saturation Curve: The excitation curve is Log-Log curve with secondary current on X coordinate
and secondary voltage on Y coordinate. Saturation curves for all correlating taps will be graphed
in the chart in the right hand corner of the screen in real time as data is accumulated.
16. At any point of time Test can be terminated by hitting the ABORT button at the top of the screen.
Figure 61 CT Saturation Testing Screen – Concurrent
17. Upon completion of test, the results can be viewed in the test screen or in a test
report.