18-1
18 Review
18.1 Accessing Respective Review Windows
1. Select the [Review] QuickKey, or [Main Menu][Review >>].
2. Select [Graphic Trends], [Tabular Trends], [Events], or [Full Disclosure] to access
their respective review windows.
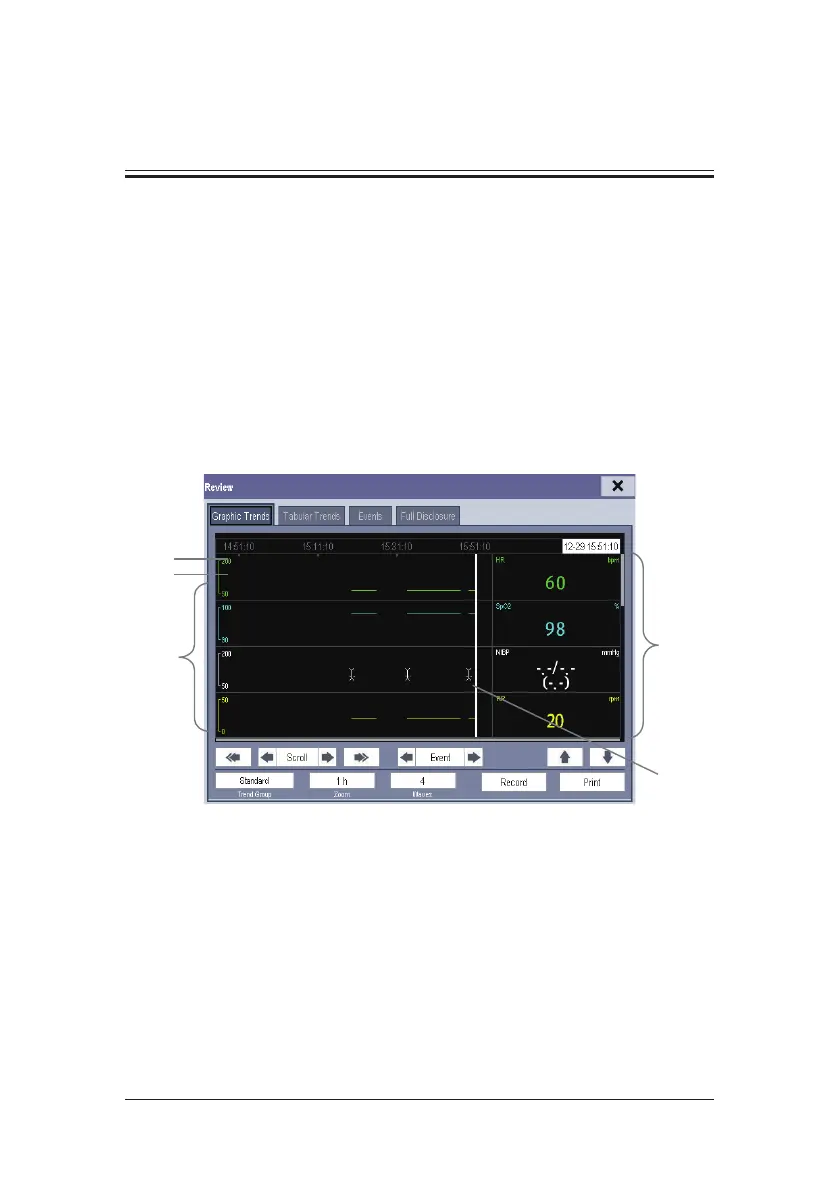
18.2 Reviewing Graphic Trends
In the [Review] menu, select [Graphic Trends] to access the following window.
(1) Event mark area (2) Time axis
(3) Graphic trends area (4) Parameter area
(5) Cursor
Events are marked with colors in the event mark area. Red represents high level alarm event.
Yellow represents medium/low level alarm event. Green represents manual event.
(1)
(2)
(3)
(4)
(5)