29
3 Advanced Operations and Useful Functions
No. 99MAM029A
3.2
D Chart (Chart Indicating Temporal Changes
of Measurement Data) Printing (MODE2)
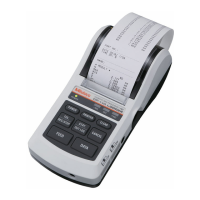
Explain the operation to print the D chart which acquaints the distribution of measure-
ment values visually when the SYSTEM MODE is "DP-1".
D chart
Upper specication limit valueCenterLower specication limit value
Tips
The D of the D chart stands for "Displacement", and the D chart is the chart that graphs the dis-
placement.
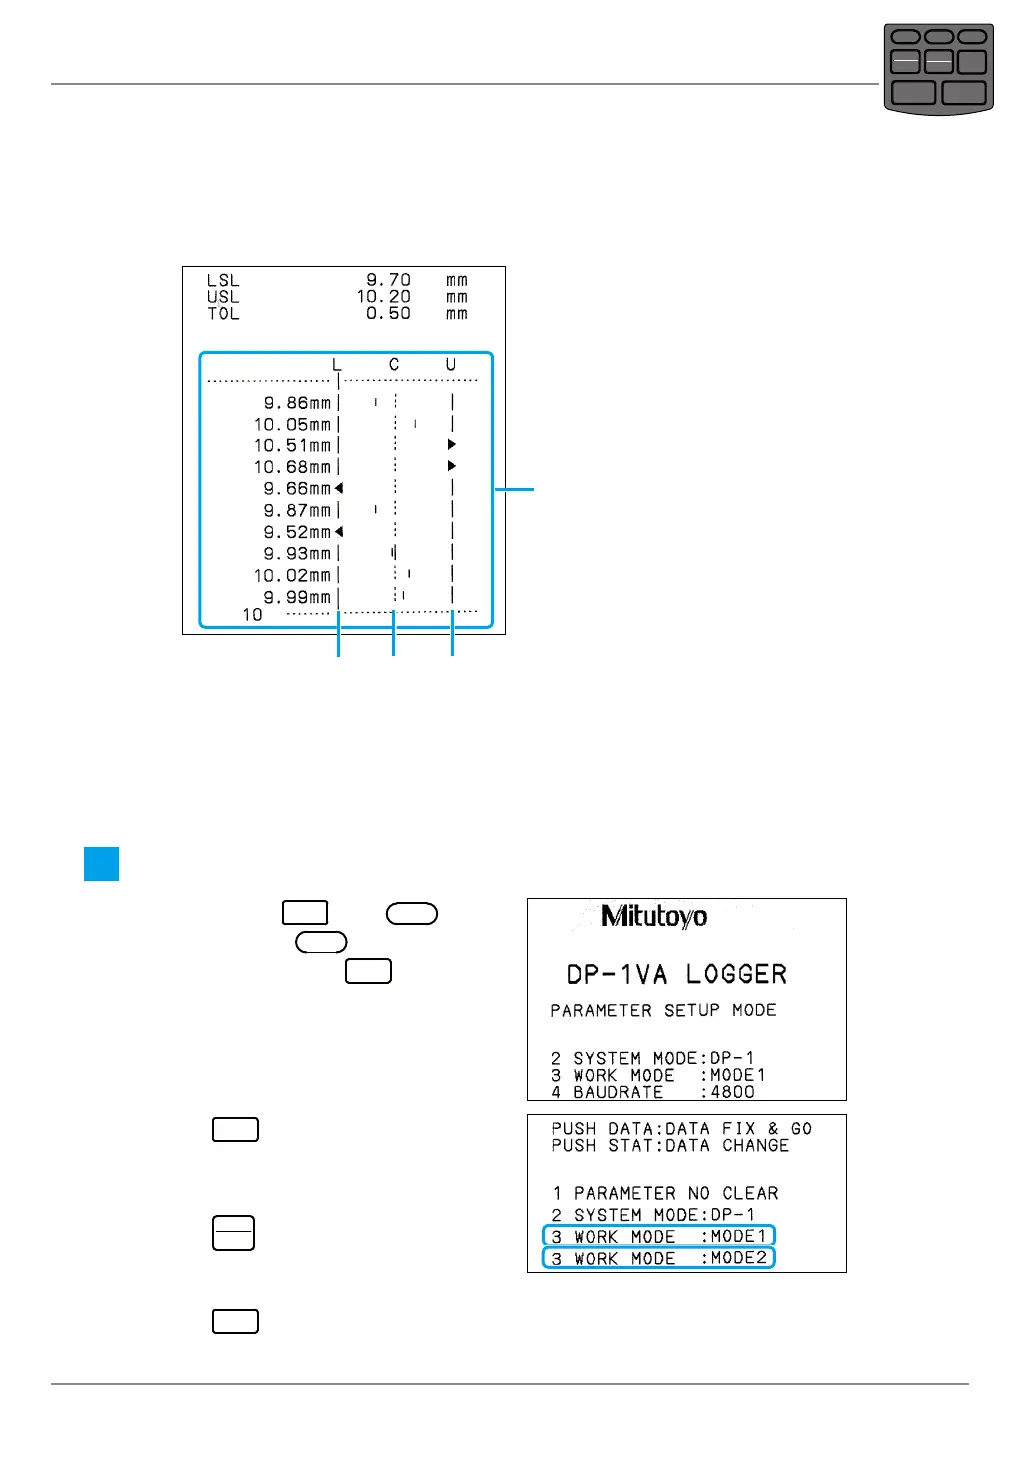
1
Set the WORK MODE to "MODE2".
1
While pressing
DATA
press
POWER
,
then just release
POWER
, when the print-
ing starts, then release
DATA
.
» The power is turned on and enters the
parameter setup mode.
2
Press
DATA
twice.
» The WORK MODE currently set is
printed.
2
3
Press
STAT.
OUT LOG
repeatedly until "3 WORK
MODE :MODE2" is printed.
4
Press
DATA
.
» "MODE2" is xed.
POWER
TOL.
REC/STOP
PRINTER
CLEAR
STAT.
OUT LOG
CANCEL
DATA
FEED
 Loading...