31
3 Advanced Operations and Useful Functions
No. 99MAM029A
3.3
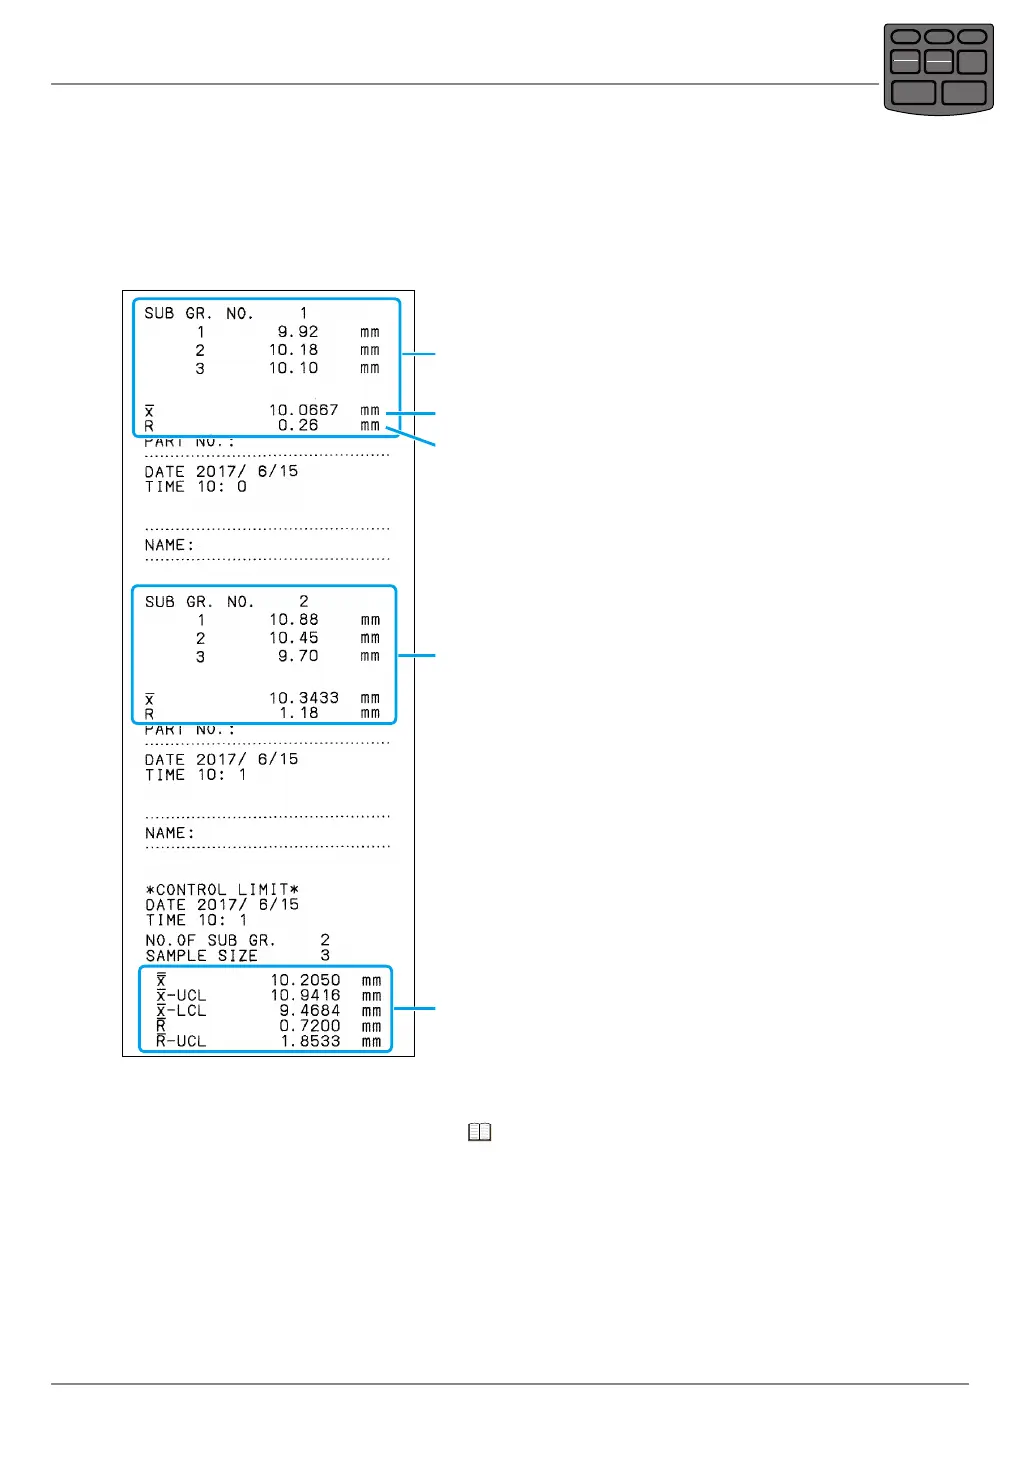
Printing the Data for Xbar-R Control
Chart (MODE3)
When the SYSTEM MODE is "DP-1", the calculation results for generating the X¯ - R c o n -
trol chart, which is one of representative control chart of sampling method of weighing
data can be printed. The printing operation is explained here.
The measurement data and calculation result of subgroup 1
The measurement data and calculation result of subgroup 2
Average value
Range
The control limit's calculation result of all the subgroup
measured before now
Tips
For further details on the formula, refer to "7.2.2 Formulas" on page 76.
POWER
TOL.
REC/STOP
PRINTER
CLEAR
STAT.
OUT LOG
CANCEL
DATA
FEED