MercuryiTC
©2014 Oxford Instruments Omicron NanoScience. All rights reserved.
Page 33
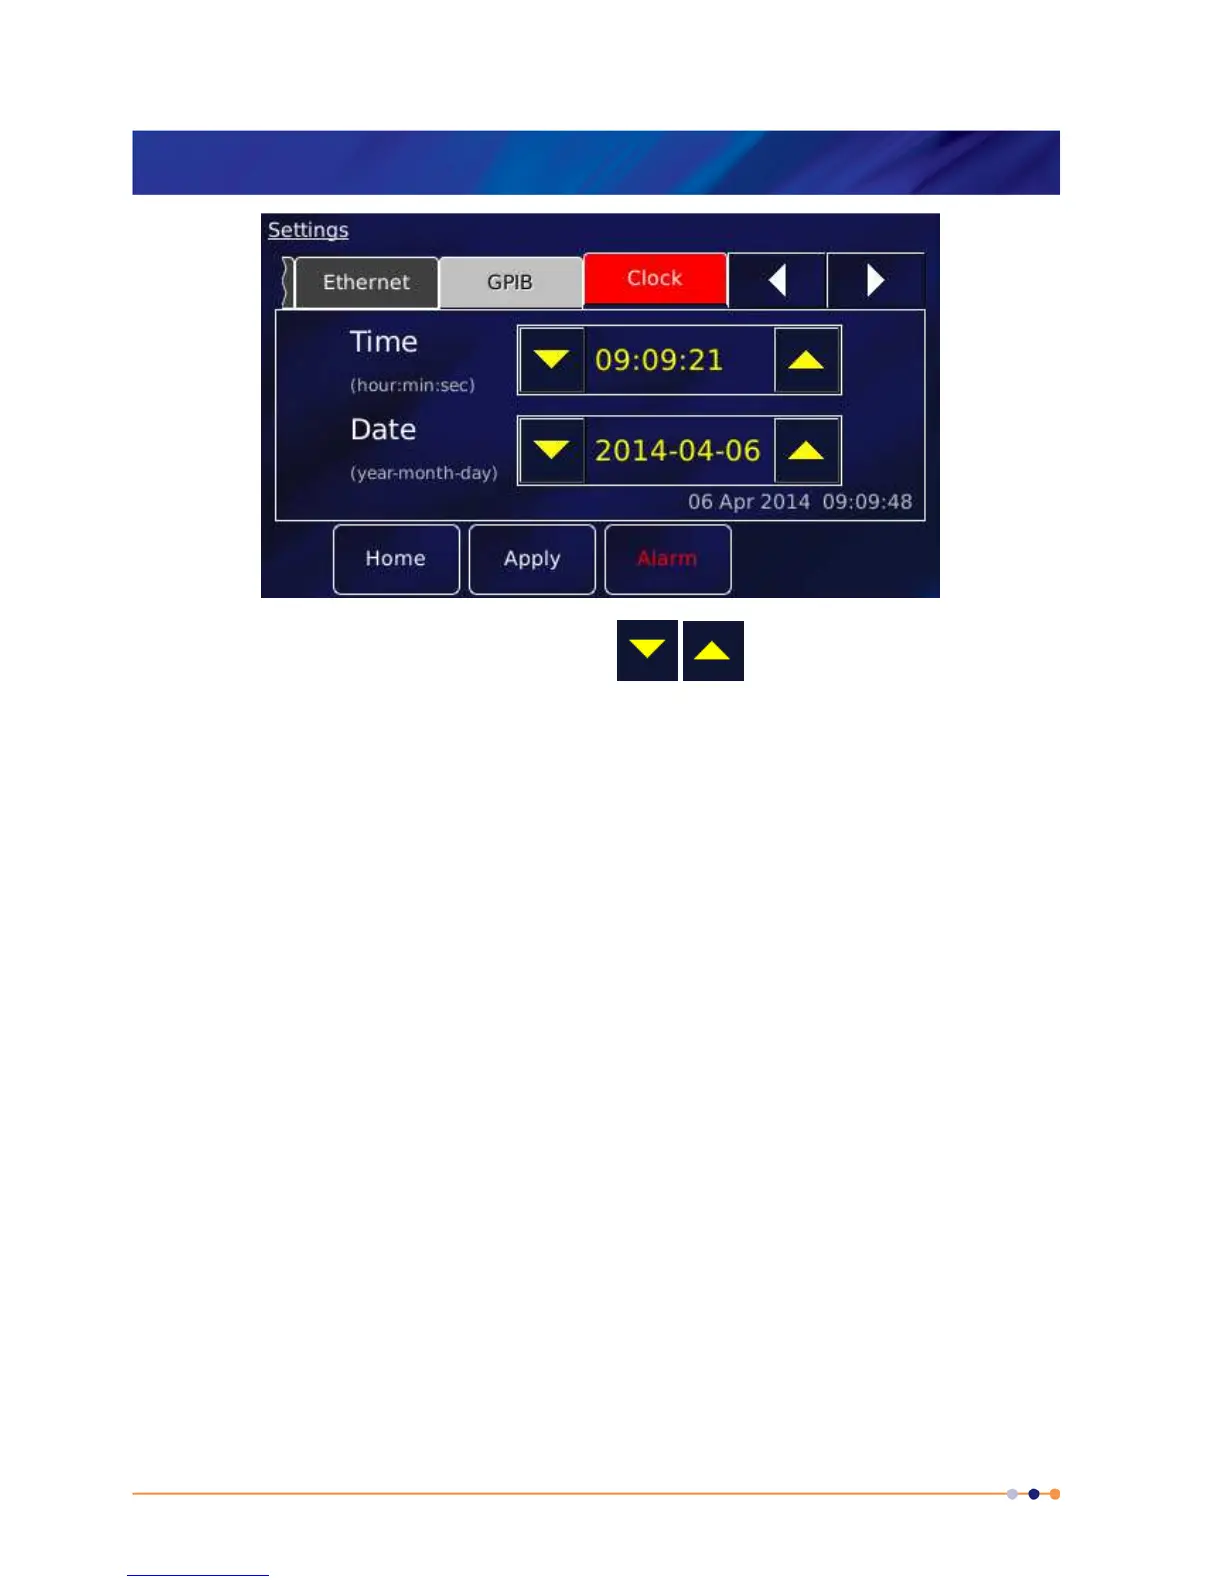
3 Edit the date and time using the scroll buttons
.
4 Tap Apply to apply the changes.
5 Tap Home to return to the Home page.
3.6 Plotting signals on the MercuryiTC touch screen
The MercuryiTC touch screen allows the user to monitor up to 6 signals as a function of time.
3.6.1 Plot Configuration
The Plot Configuration page is used to set up which signals are to be plotted. When the plot
page has been configured, the trace updates in real time.
1 Tap the Plot button on the Home page to display the Plot Configuration page.
2 If a plot is displayed, tap the plot area once. The Plot Configuration page appears as an
overlay on the Plot page.
 Loading...