X-Series Hyperconverged Nodes Powered by Acuity
Setup & User Guide, v1.0
| 42
DOC-246-GDE-Pivot3 Acuity 2.3 Setup & User Guide-v1.0.docx
3. VM’s CPU & Memory Utilization
This component shows a list of VMs, the vCenter datastore volume that the VMs reside on, and the maximum CPU
and Memory Utilization they were configured with. Click the refresh icon ( ) at the top right of the component to
populate this data.
4. Nodes & Devices
This component shows a list of nodes in the vPG as well as a detailed summary of the devices inside the selected
node. Selecting a node displays a graphical representation of the devices in the node with details on the device’s
state, tier type, model name, capacity, and location. It will also show the NVMe details once the NVMe icon is
clicked (this is only applicable to accelerated nodes). A colored status dot provides a quick indication of device
status with the following color code:
Normal (Green) Failed (Red) Rebuilding (Blue)
NOTE: The position of the drive in the graphical representation does not represent the physical location of the drive
in the node. Drive placement information is provided at the bottom of the window when the drive is selected
in the
Nodes & Devices component.
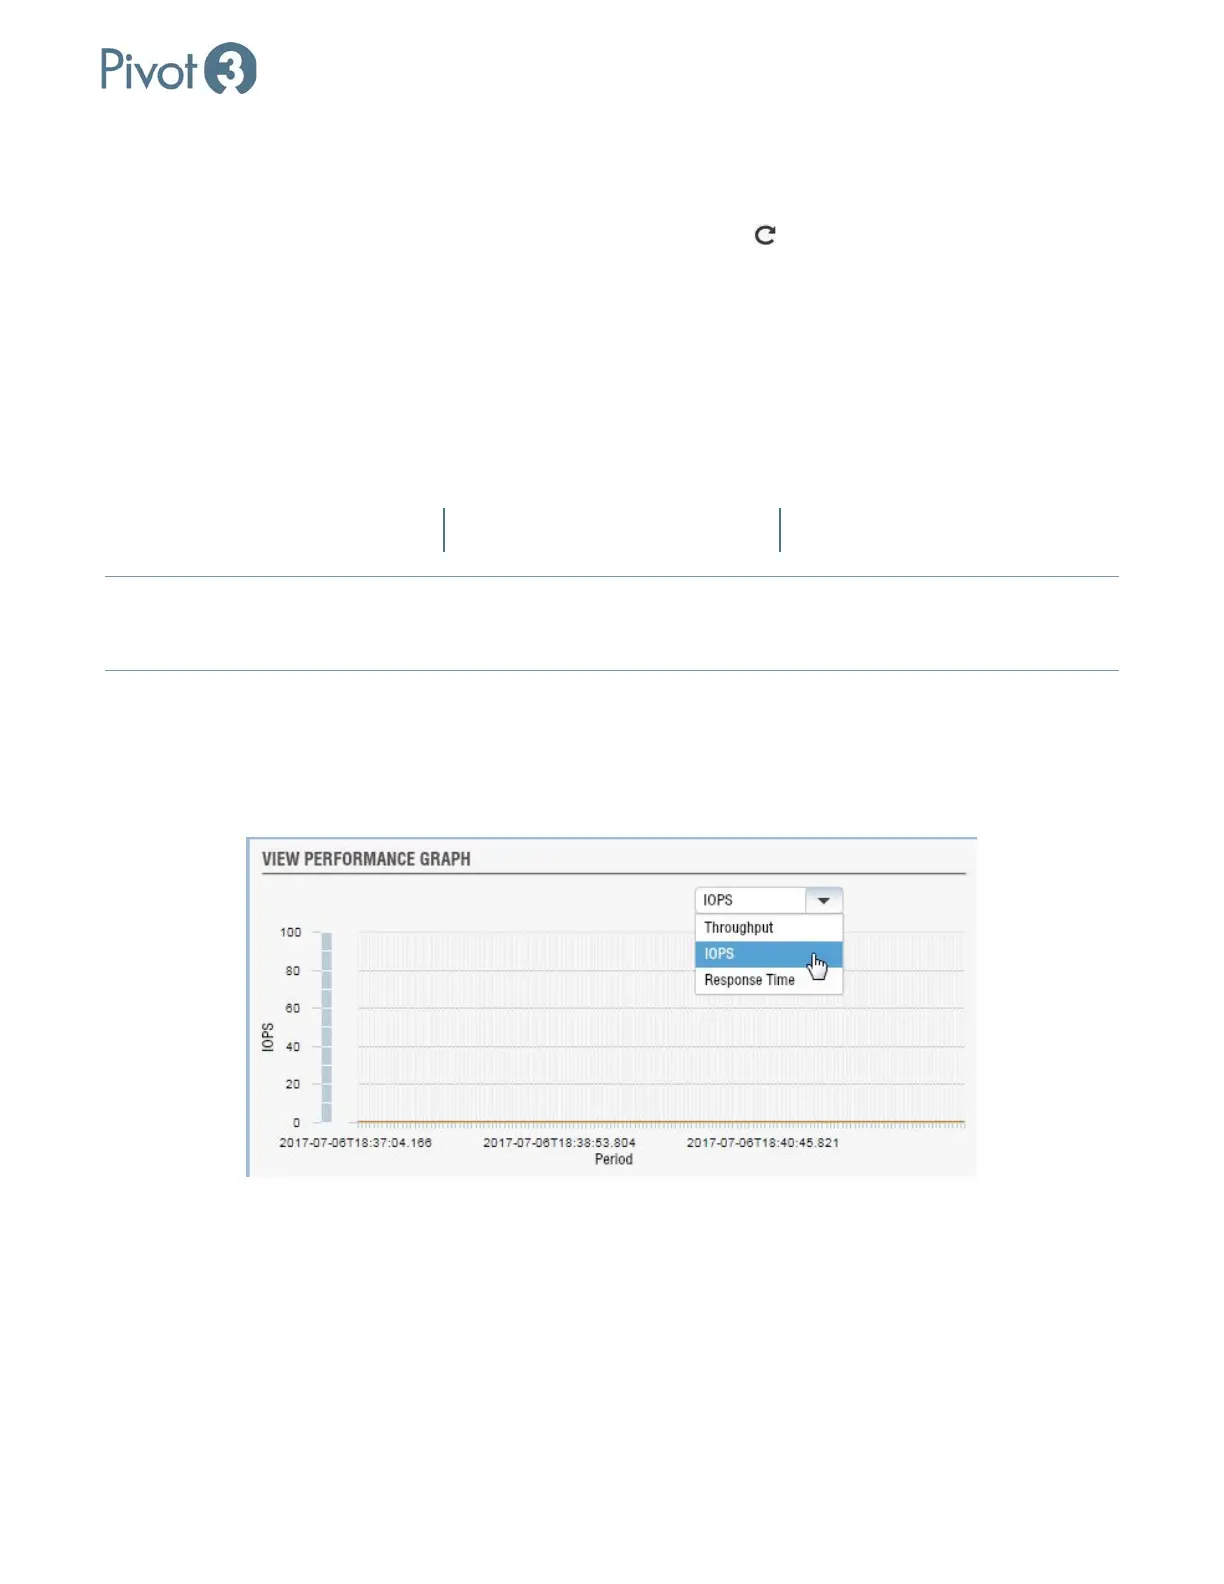
5. View Performance Graph
This component shows a graph of select details for the currently selected vPG. Choose which data to display from
the drop-down box at the top right of the component. Data choices are Throughput, IOPS, or Response Time.
The chart will then populate with a line graph displaying the selected data for the last 10 minutes.