Setup & User Guide
| 50
DOC-246-GDE-Pivot3 Acuity 2.3 Setup & User Guide-v1.0.docx
Toolbox: Overview & Reporting
The Toolbox tab has been provided as a central location for tools that are useful for diagnosing potential issues on
managed vPGs. There are three categories for the Toolbox view: Performance Monitor, Performance Diagnostics, and
Connection Map.
CRITICAL:
The Toolbox tab will not populate until a vPG is chosen in the dropdown box in the top right of the screen.
Performance Monitor
The Performance Monitor view provides a view of the activity within the domain and each volume within an Acuity vPG.
These charts update continuously for the most up-to-date information.
NOTE
: Only Acuity vPGs will be visible in this section. vSTAC vPGs will be greyed out and not selectable.
Begin by choosing a vPG to monitor in the top right drop-down box.
For the selected vPG, make selections from the drop-down boxes at the top of the graph. Up to 12 graphs may be
displayed simultaneously for comparison viewing.
NOTE: To switch the graph from one view to another, make different selections in the drop-down boxes and click Update
.
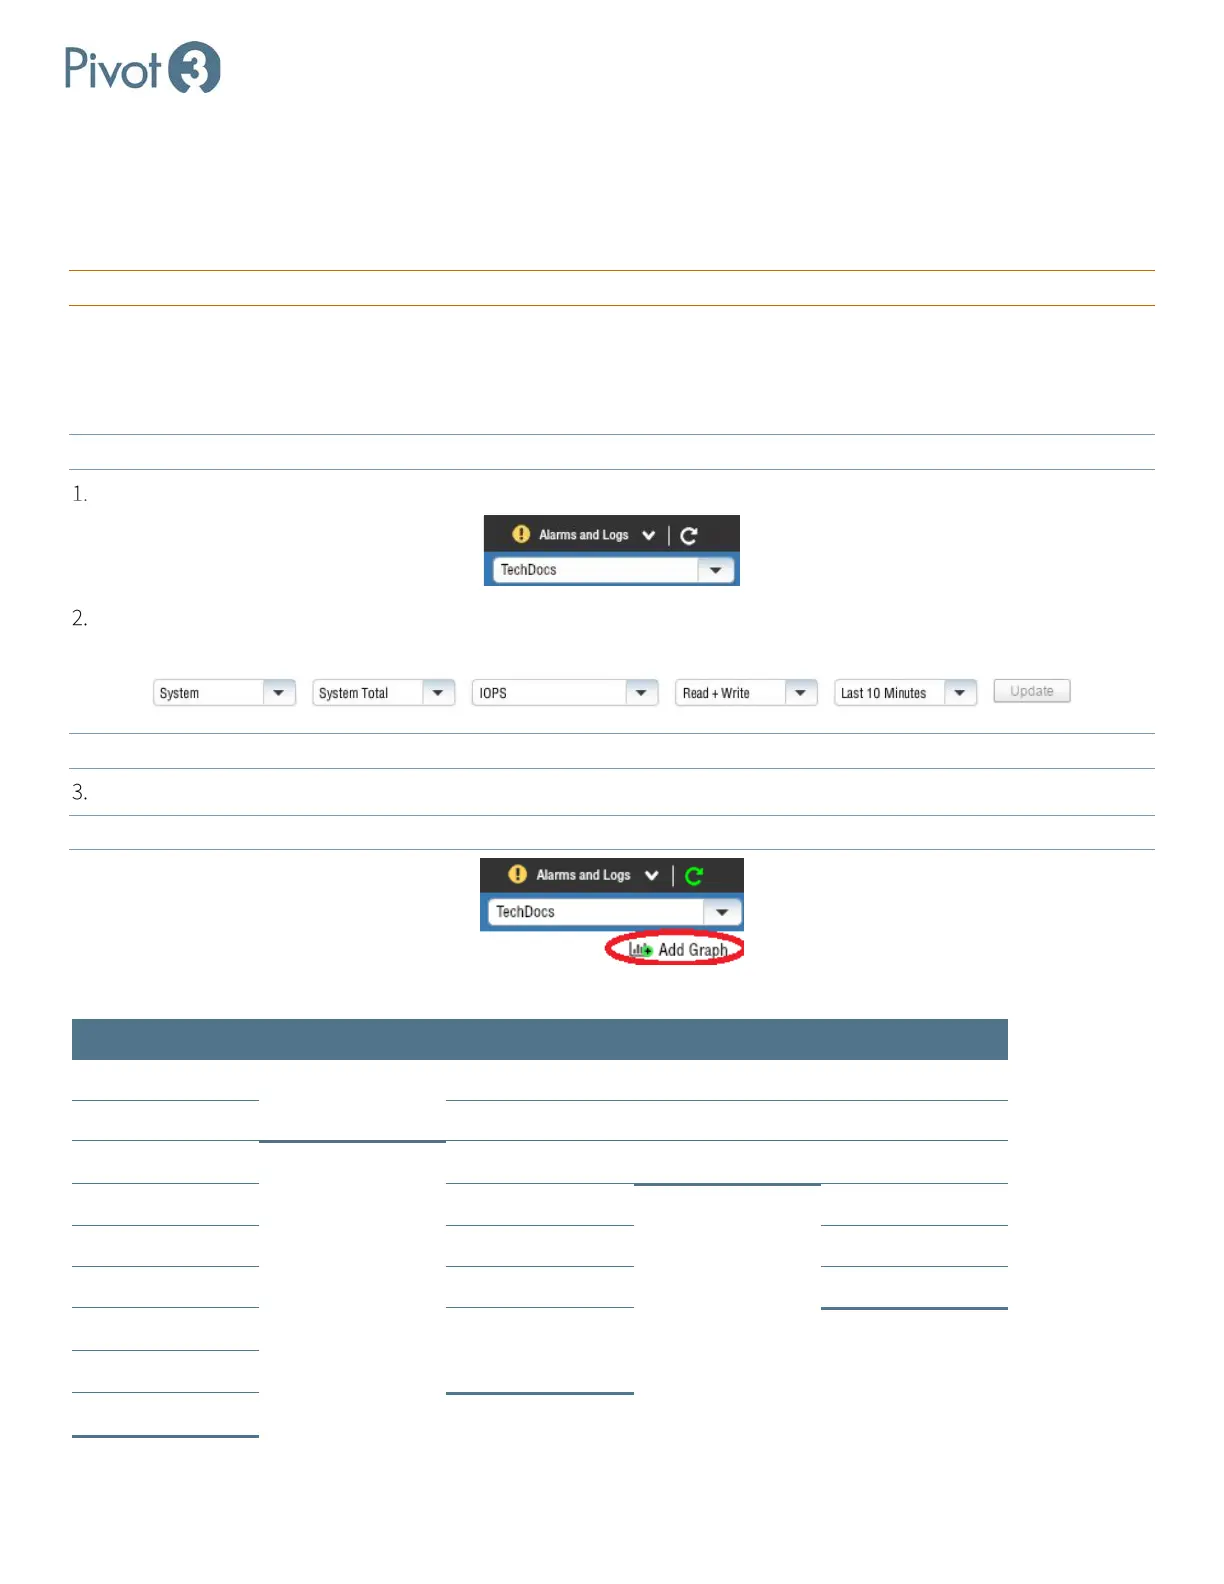
To add a new live monitor, click the Add Graph feature under the vPG dropdown box.
NOTE:
Maximum of 12 graphs are available at one time.
The options are broken out in the table below:
Type of Monitor Category Metrics I/O Type Interval
System Contingent on
Monitor Selection
Throughput Read Last 10 Minutes
Service Level IOPS Write Last Hour
Policy Queue Depth Read + Write Last Day
Volume Block Size Last Week
Storage Processor Response Time Last Month
Network Port IOPS Histogram Last Year
Access Group Response Time
Histogram
Host Connection
Tier