10.1.2 Selecting Statistical Method
After entering the common analysis interface, tap Method to pop up the statistical
method setting menu. You can select RT Plot or Trend Plot.
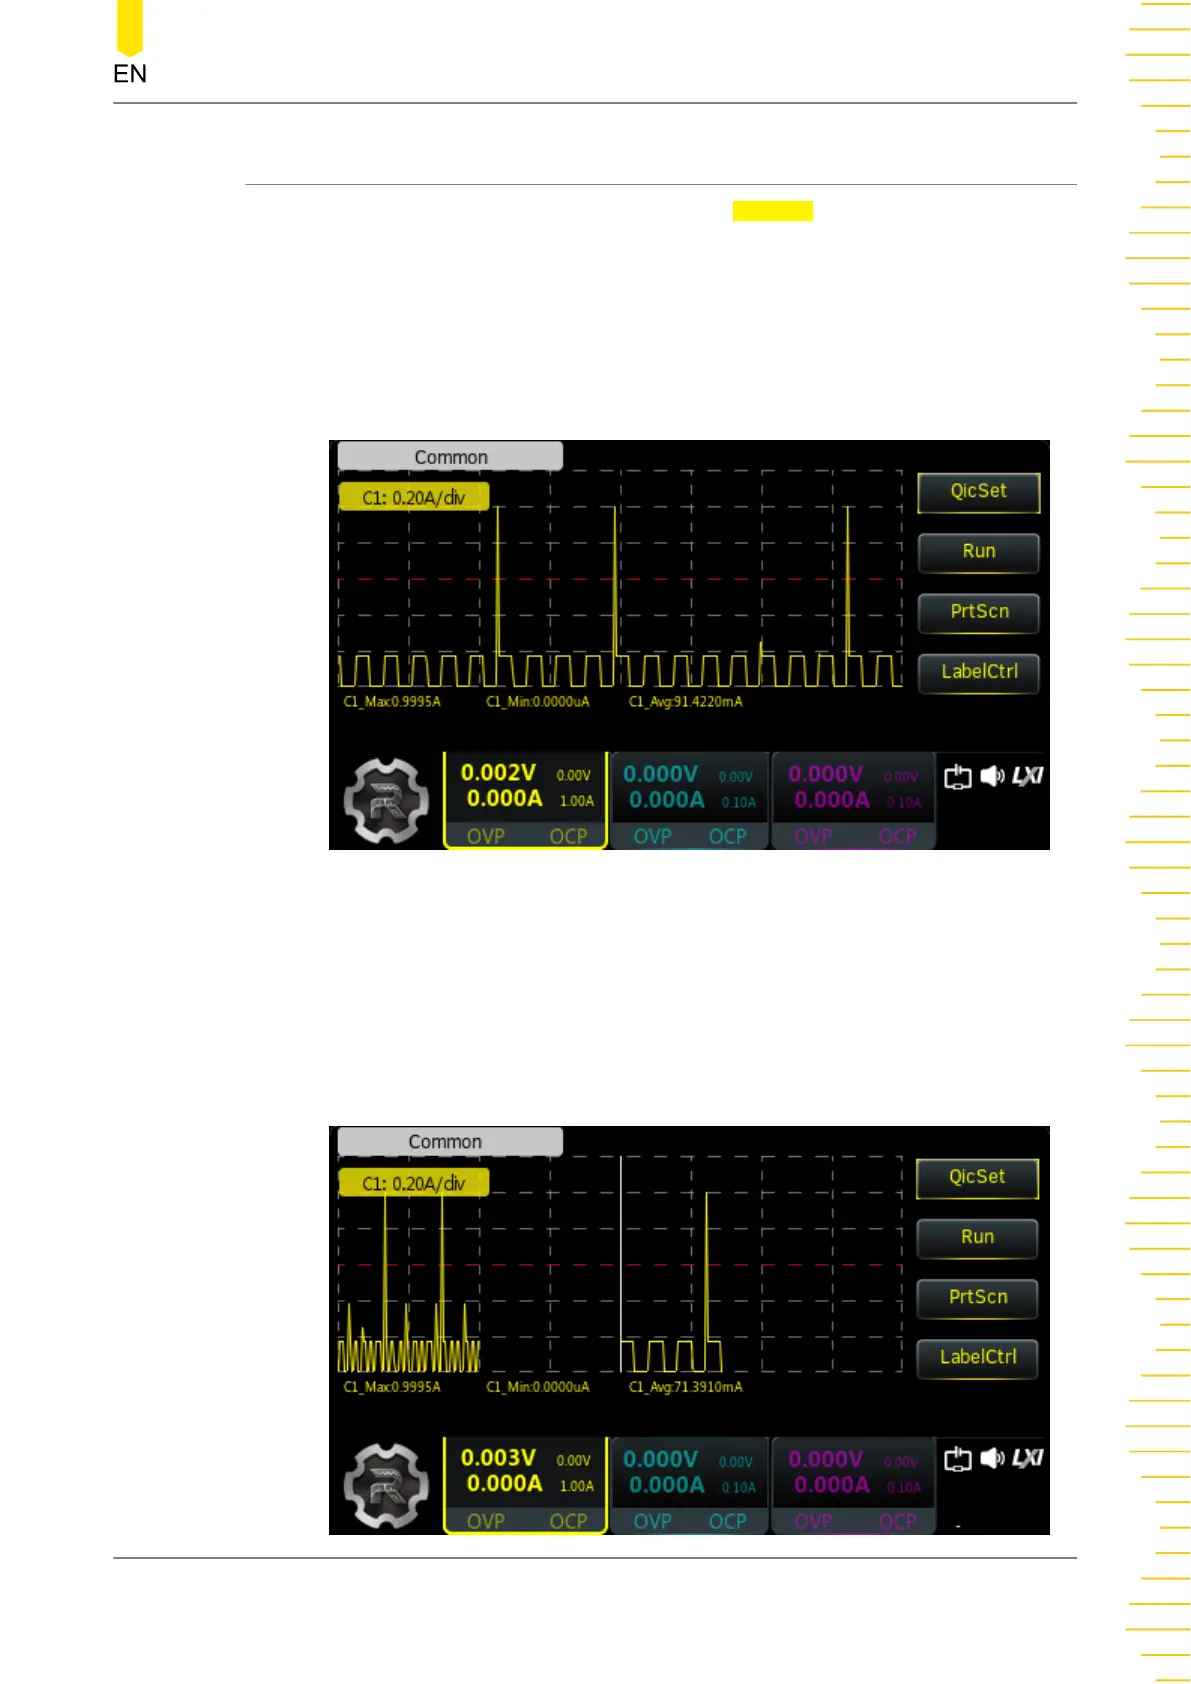
• RT Plot
It displays the analysis object currently selected in real-time plot. In RT Plot
mode, the waveform of the collected signals slowly scrolls from right to left. The
latest data is displayed on the screen.
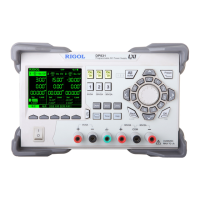
• Trend Plot
It displays the analysis object currently selected in trend plot. In Trend Plot
mode, the waveform plot area is divided into two parts: the left displays trend
waveform while the right displays real-time data. Real-time data will be drawn
point by point. When the data is out of the screen, it will be compressed and
displayed proportionally in the trend plot. Then, real-time data will be redrawn
from left to right.
Analyzer
Copyright ©RIGOL TECHNOLOGIES CO., LTD. All rights reserved.
DP2000 User Guide
51