icon for selecting the view type. An additional menu appears, where type of view of the LIVE
mode can be changed
screenshot Selecting it saves the current contents of the main window to a graphic file. The file
name is automatically created basing on the view name and the current date, for example "Cur-
rent Readings - waveforms – 2016-08-01 12_00_00”. The files are saved to the internal memory
of the meter
return to the main menu of the recorder mode
The diagram can be scaled with gestures. To zoom in, spread the two fingers
touching the screen in the opposite directions). To zoom out – bring together the
two fingers touching the screen).
Waveforms return to their default size after turning on/off any channel (buttons on
the right side).
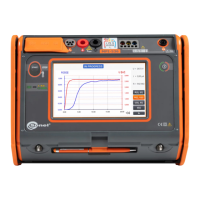
4.6.3 "Live" mode - tabular view
After the icon has been selected a summary table with the values of network parameters is dis-
played. The table is refreshed in real time. A sample screen is shown in Fig. 4.15
Fig. 4.15. Live mode - measurements
The next lines were determined as follows:
L1 ............................... phase values L1,
L2 ............................... phase values L2,
L3 ............................... phase values L3,
N ................................. voltage values of the current channel I
N,
L1-2 ............................ phase-to-phase values L1-L2,
L2-3 ............................ phase-to-phase values L2-L3,
L3-1 ............................ phase-to-phase values L3-L1,
Σ ................................. total values.