4.6.2 Timeplot of effective values
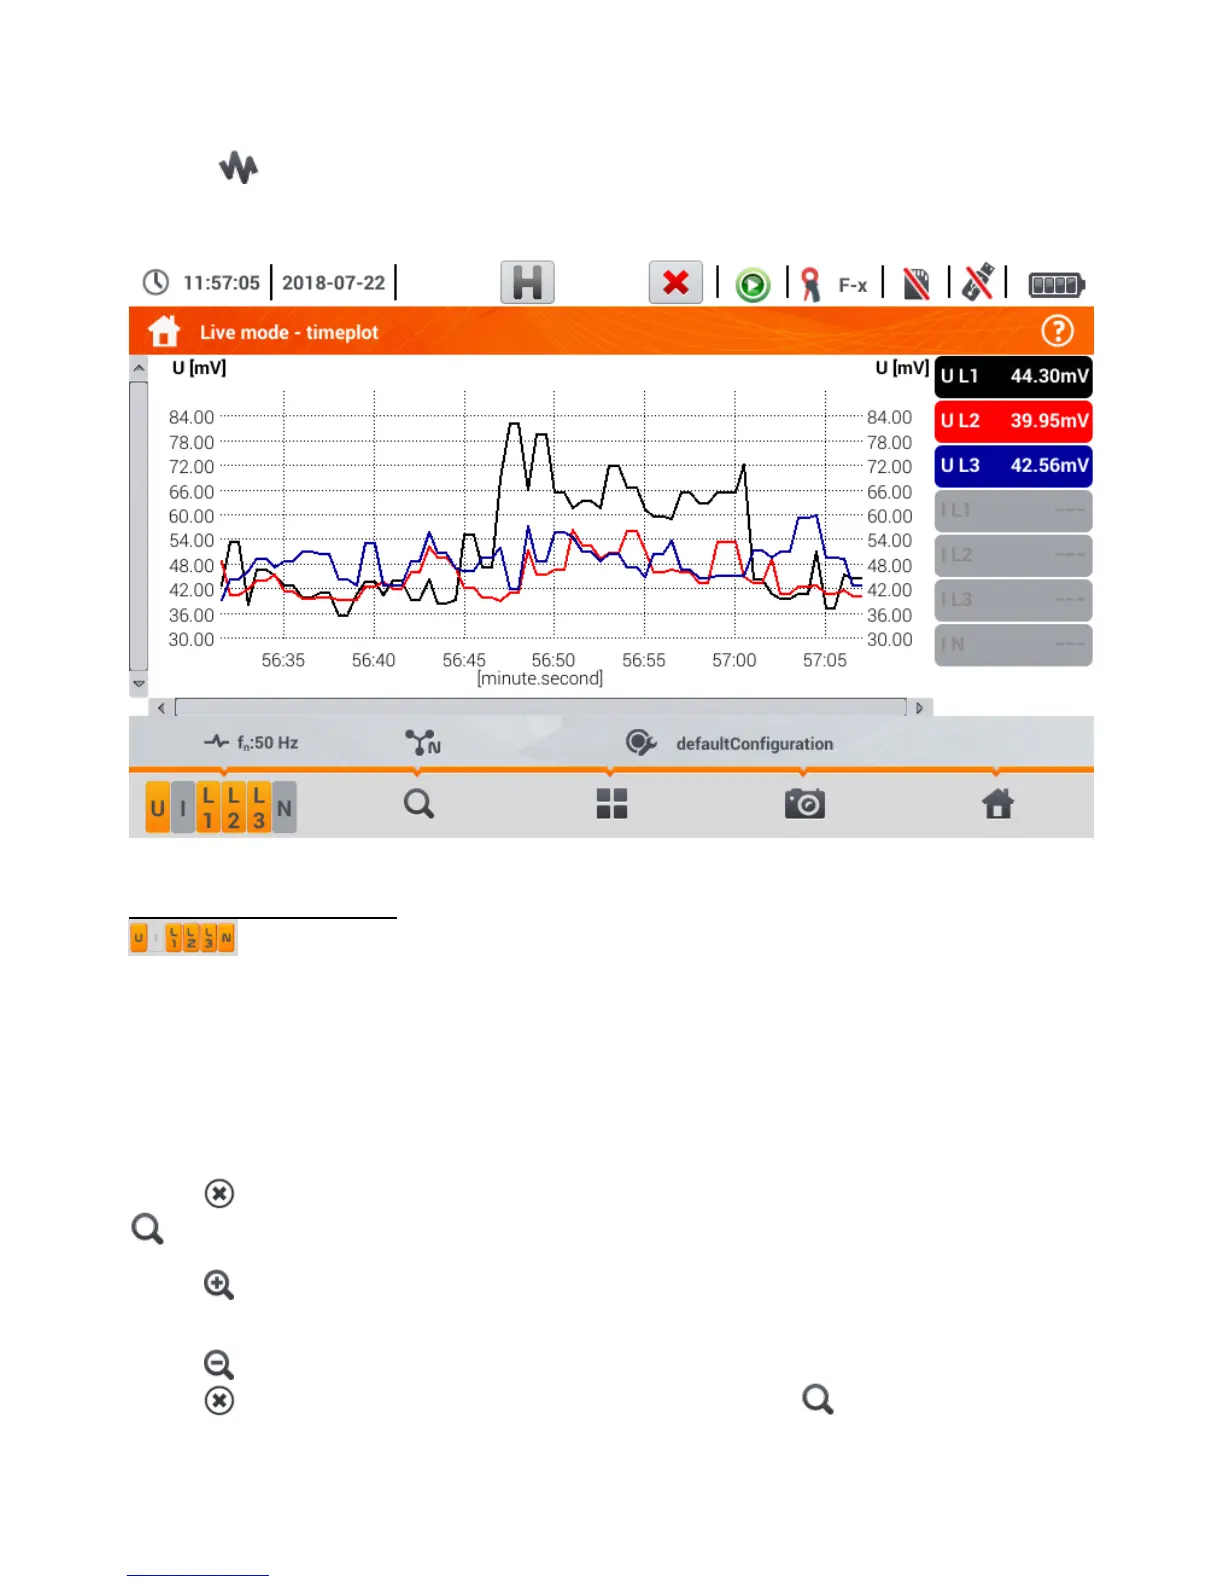
After the icon has been selected, the view of timeplot is displayed (Fig. 4.14). This view displays
a graph of the effective values of voltages and currents in time. The whole window covers time of ap-
prox. 110 seconds. After filling the entire window, the chart moves to the left by 30 seconds.
Fig. 4.14. "Live" mode - timeplot
Description of function icons
Menu of active channels. After touching, an additional menu bar is opened with buttons
for enabling or disabling the display of a phase or current and voltage. The active channel is in-
dicated by orange colour of the icon. Remember that the screen must always display at least
one waveform (you can not turn off all of them). The menu displays only the buttons of chan-
nels that exist in the network layout. From this menu you can turn off:
U collectively all voltage waveforms
I collectively all current waveforms
L1 collectively all phase L1 waveform
L2 collectively all phase L2 waveforms
L3 collectively all phase L3 waveforms
selecting this icon closes the menu
zooming of the displayed waveform. After the icon has been selected, a menu expands with the
following options:
after selecting this icon, use you finger to circle the area which is to be zoomed in.
The graph will be enlarged. After zooming in it may be moved with a finger up, down
and to the sides
after selecting this icon graph will be zoomed out in steps.
selecting this icon closes the zooming menu (also, the may be selected)