4.6.5 Harmonics graph/table
After the icon has been selected the mode of harmonics display is displayed. This screen allows
you to view the harmonics of voltages and currents, angles between the current and voltage harmon-
ics, cosφ factors of these currents and THD factors. Harmonics are displayed graphically in a bar
graph (default) or in a table.
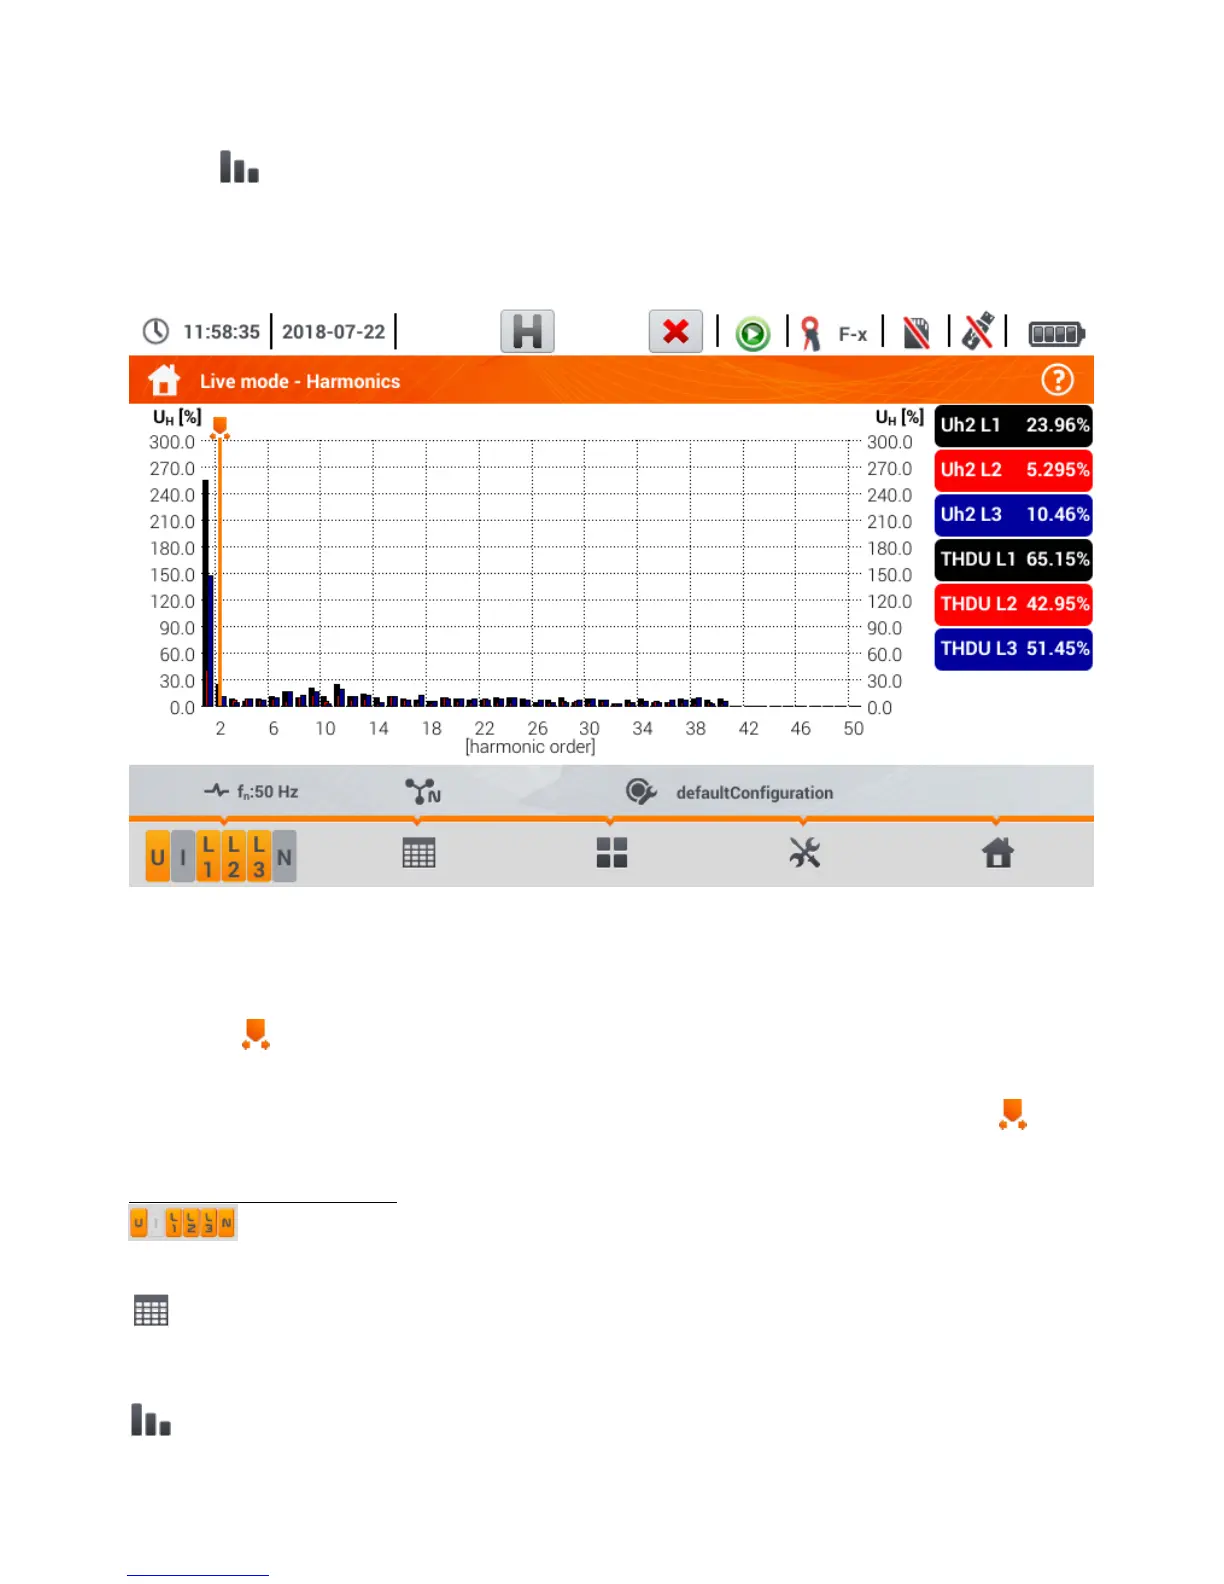
Fig. 4.17 Live mode - harmonics - bar graph
The graph includes:
o graphs for the harmonics selected from the menu Graph data selection,
o slider - indicator of actual values. The user can slide it to any graph point.
Labels of individual waveforms are located on the right side of the screen. They display the participa-
tion of harmonics in the basic signal for these harmonics, which are indicated by the slider . In ad-
dition, tapping the label hides its corresponding graph (in graph mode only).
Description of function icons
menu of active channels. After clicking, an additional menu bar is opened with icons for
enabling or disabling the data and to switch between current and voltage harmonics. The active
channel is indicated by orange colour of the icon
switching to tabular view of harmonics (Fig. 4.18). The table in each row displays the harmonic
values (from DC harmonic to the harmonic of 40th order) or the angles between the current and
voltage harmonics. In case of harmonics, the values may be displayed in absolute units (V/A),
or as percentage related to the fundamental harmonic
switching to histogram view