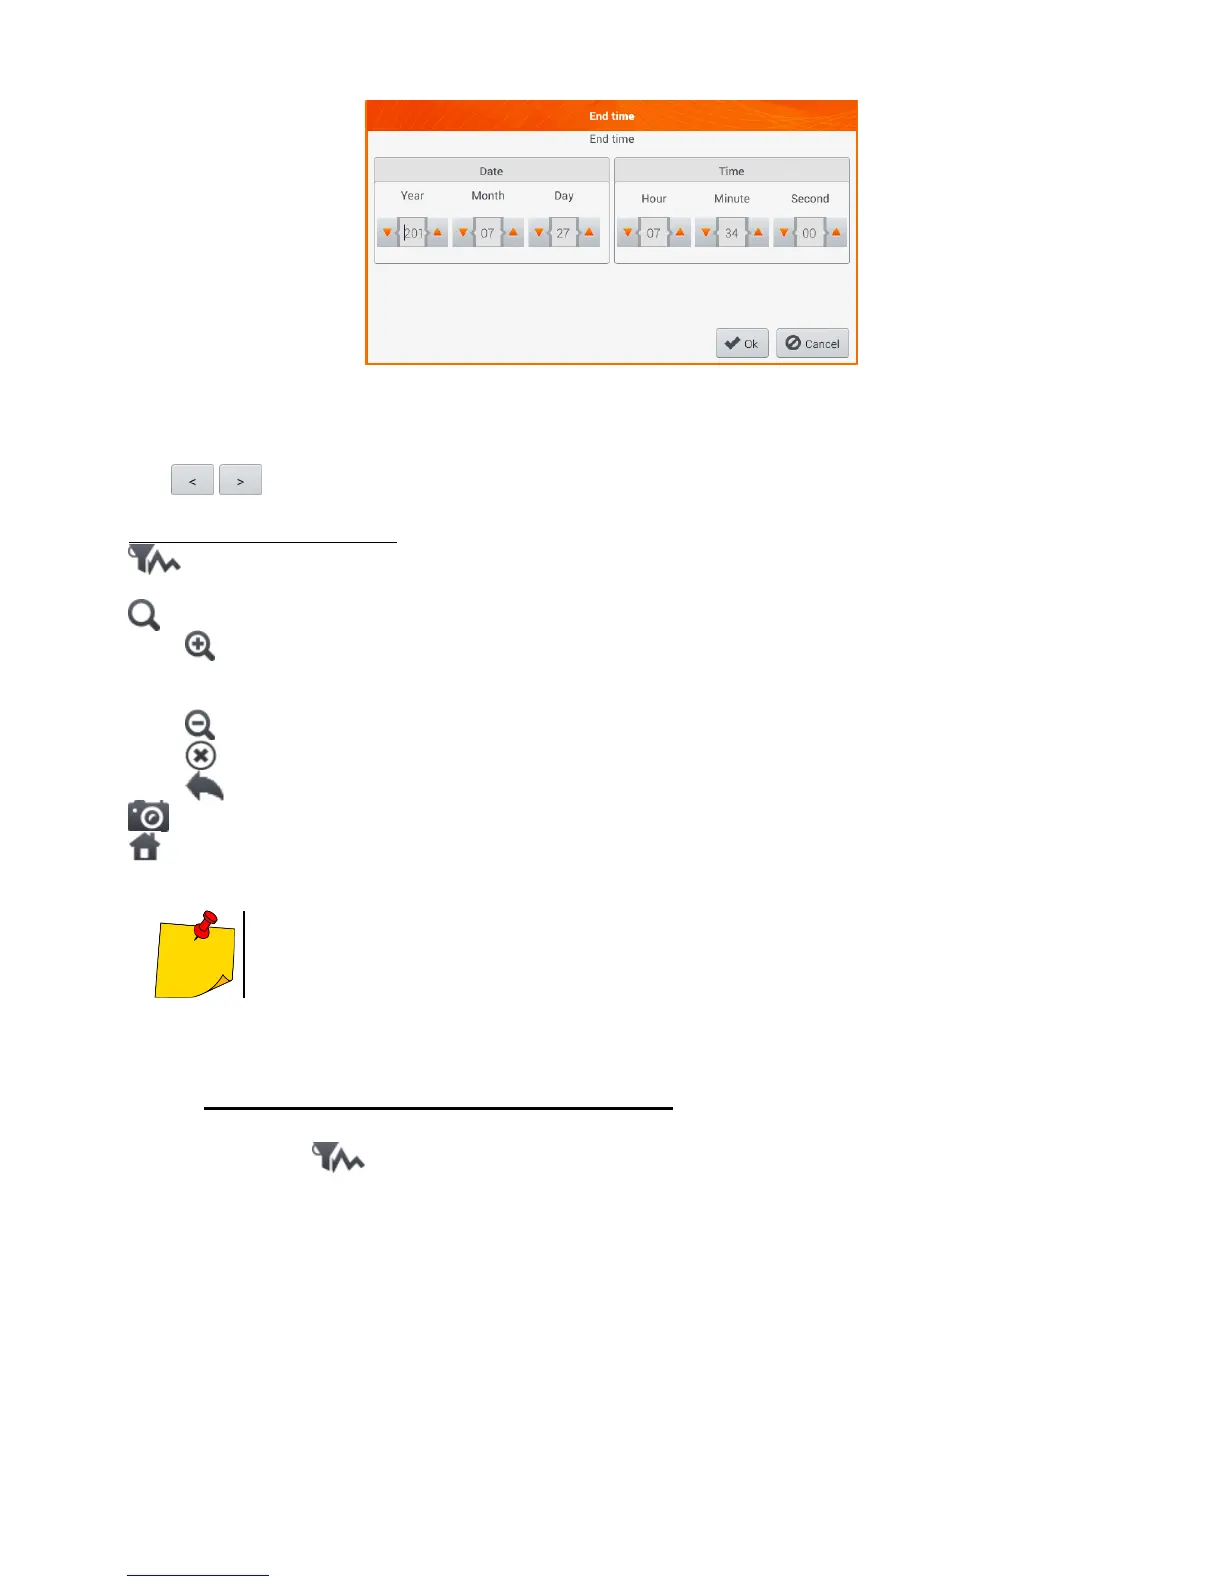
Fig. 4.22 Setting the end of the analysis range
The icons reset the analysis range to initial settings.
Description of function icons
opens the Selecting data for the plot menu. The parameters to be analysed can be selected
on this screen. A detailed description is provided in point b.
zooming of the displayed waveform. After tapping, an additional menu expands with icons:
after selecting this icon, use you finger to circle the area which is to be zoomed in. The
graph will be enlarged. After zooming in it may be moved with a finger up, down and to
the sides
after selecting this icon graph will be zoomed out in steps
selecting this icon closes the zooming menu
returning to Recording analysis – recording summary menu
performing the screenshot
return to the main menu of the recorder mode
The diagram can be scaled with gestures. To zoom in, move apart the two fingers
touching the screen in the opposite directions). To zoom out – bring together the
two fingers touching the screen).
b. Selecting parameters for the timeplot
After selecting the icon, the Selecting data for the plot screen opens. The parameters to be
analysed can be selected here. Types of readings are assigned to each of the categories, and the pa-
rameters which may be selected are assigned to these.